Converting Peloton resistance to Bowflex C6 resistance
Visualizing spin bike difficulty
Around the holidays, my partner and I decided to bring a stationary exercise bike into our home. After many pros and cons lists, we opted for the Bowflex C6. I decided to try out this whole Peloton thing, and quickly found that the resistance adjustments are not equivalent between the Peloton bike and the C6. Thankfully, there is a wonderful subreddit just for this model! The folks there directed me to this conversion chart, which then led me to a 3D-printed plate to keep on my handlebars.
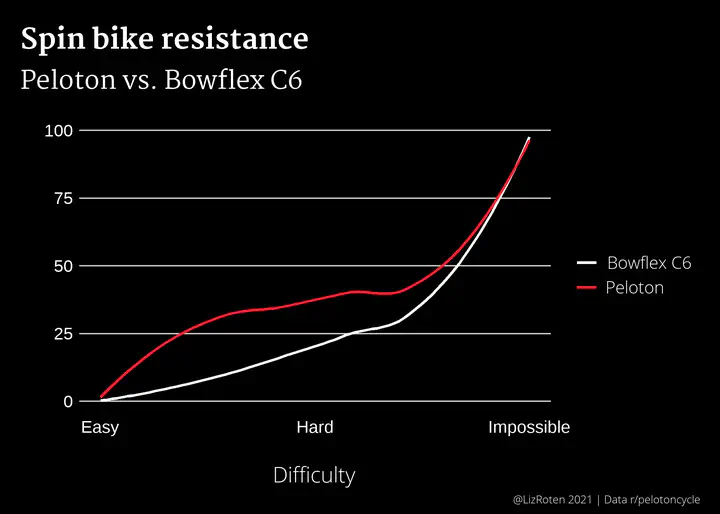
As I kept going along in my classes, all I could think was “What does this look like on a plot? What is the distribution?” Here is the result.
Load packages
## load packages
library(dplyr)
library(tidyr)
library(purrr)
library(ggplot2)
library(Cairo)

## theme and Peloton(c) red
source("theme.R")
pelo_red <- "#df1c2f"
You can find theme.R in this site’s GitHub repo.
Create tibble
Create data table.
conv_table <- tibble(C6 = c(0, 5, 9, 17, 25, 33, 49, 100),
                     Peloton = c(0, 25, 30, 35, 40, 45, 50, 100),
                     Difficulty = seq(from = 0, to = 10, length.out = 8 ))

conv_table_long <- conv_table %>%
  gather(C6, Peloton, key = "Bike", value = "Resistance")
Plot
Make the plot.
plot <- ggplot(data = conv_table_long) +
geom_smooth(mapping = aes(x = Difficulty,
y = Resistance,
color = Bike),
se = FALSE) +
scale_color_manual(values = c("white",
pelo_red),
labels = c("Bowflex C6",
"Peloton")) +
scale_x_continuous(n.breaks = 3,
labels = c("Easy",
"Hard",
"Impossible")) +
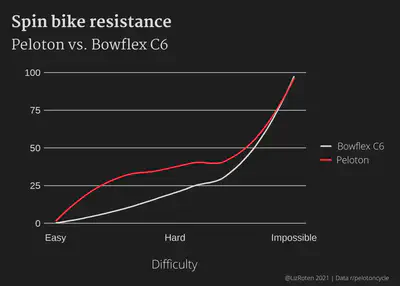
labs(title = "Spin bike resistance",
subtitle = "Peloton vs. Bowflex C6",
x = "Difficulty",
caption = "@LizRoten 2021 | Data r/pelotoncycle") +
my_theme
Display plot
plot
Update!
I was scrolling through aforementioned r/SchwinnIC4_BowflexC6 and found a post by another data person!
2021-07-08 It seems as though the Reddit user (u/raintower579) who created the formula has drifted into spam territory. The comment they made with the formula has been deleted. See the actual post here. Huge thanks to Phillip for contacting me regarding this.
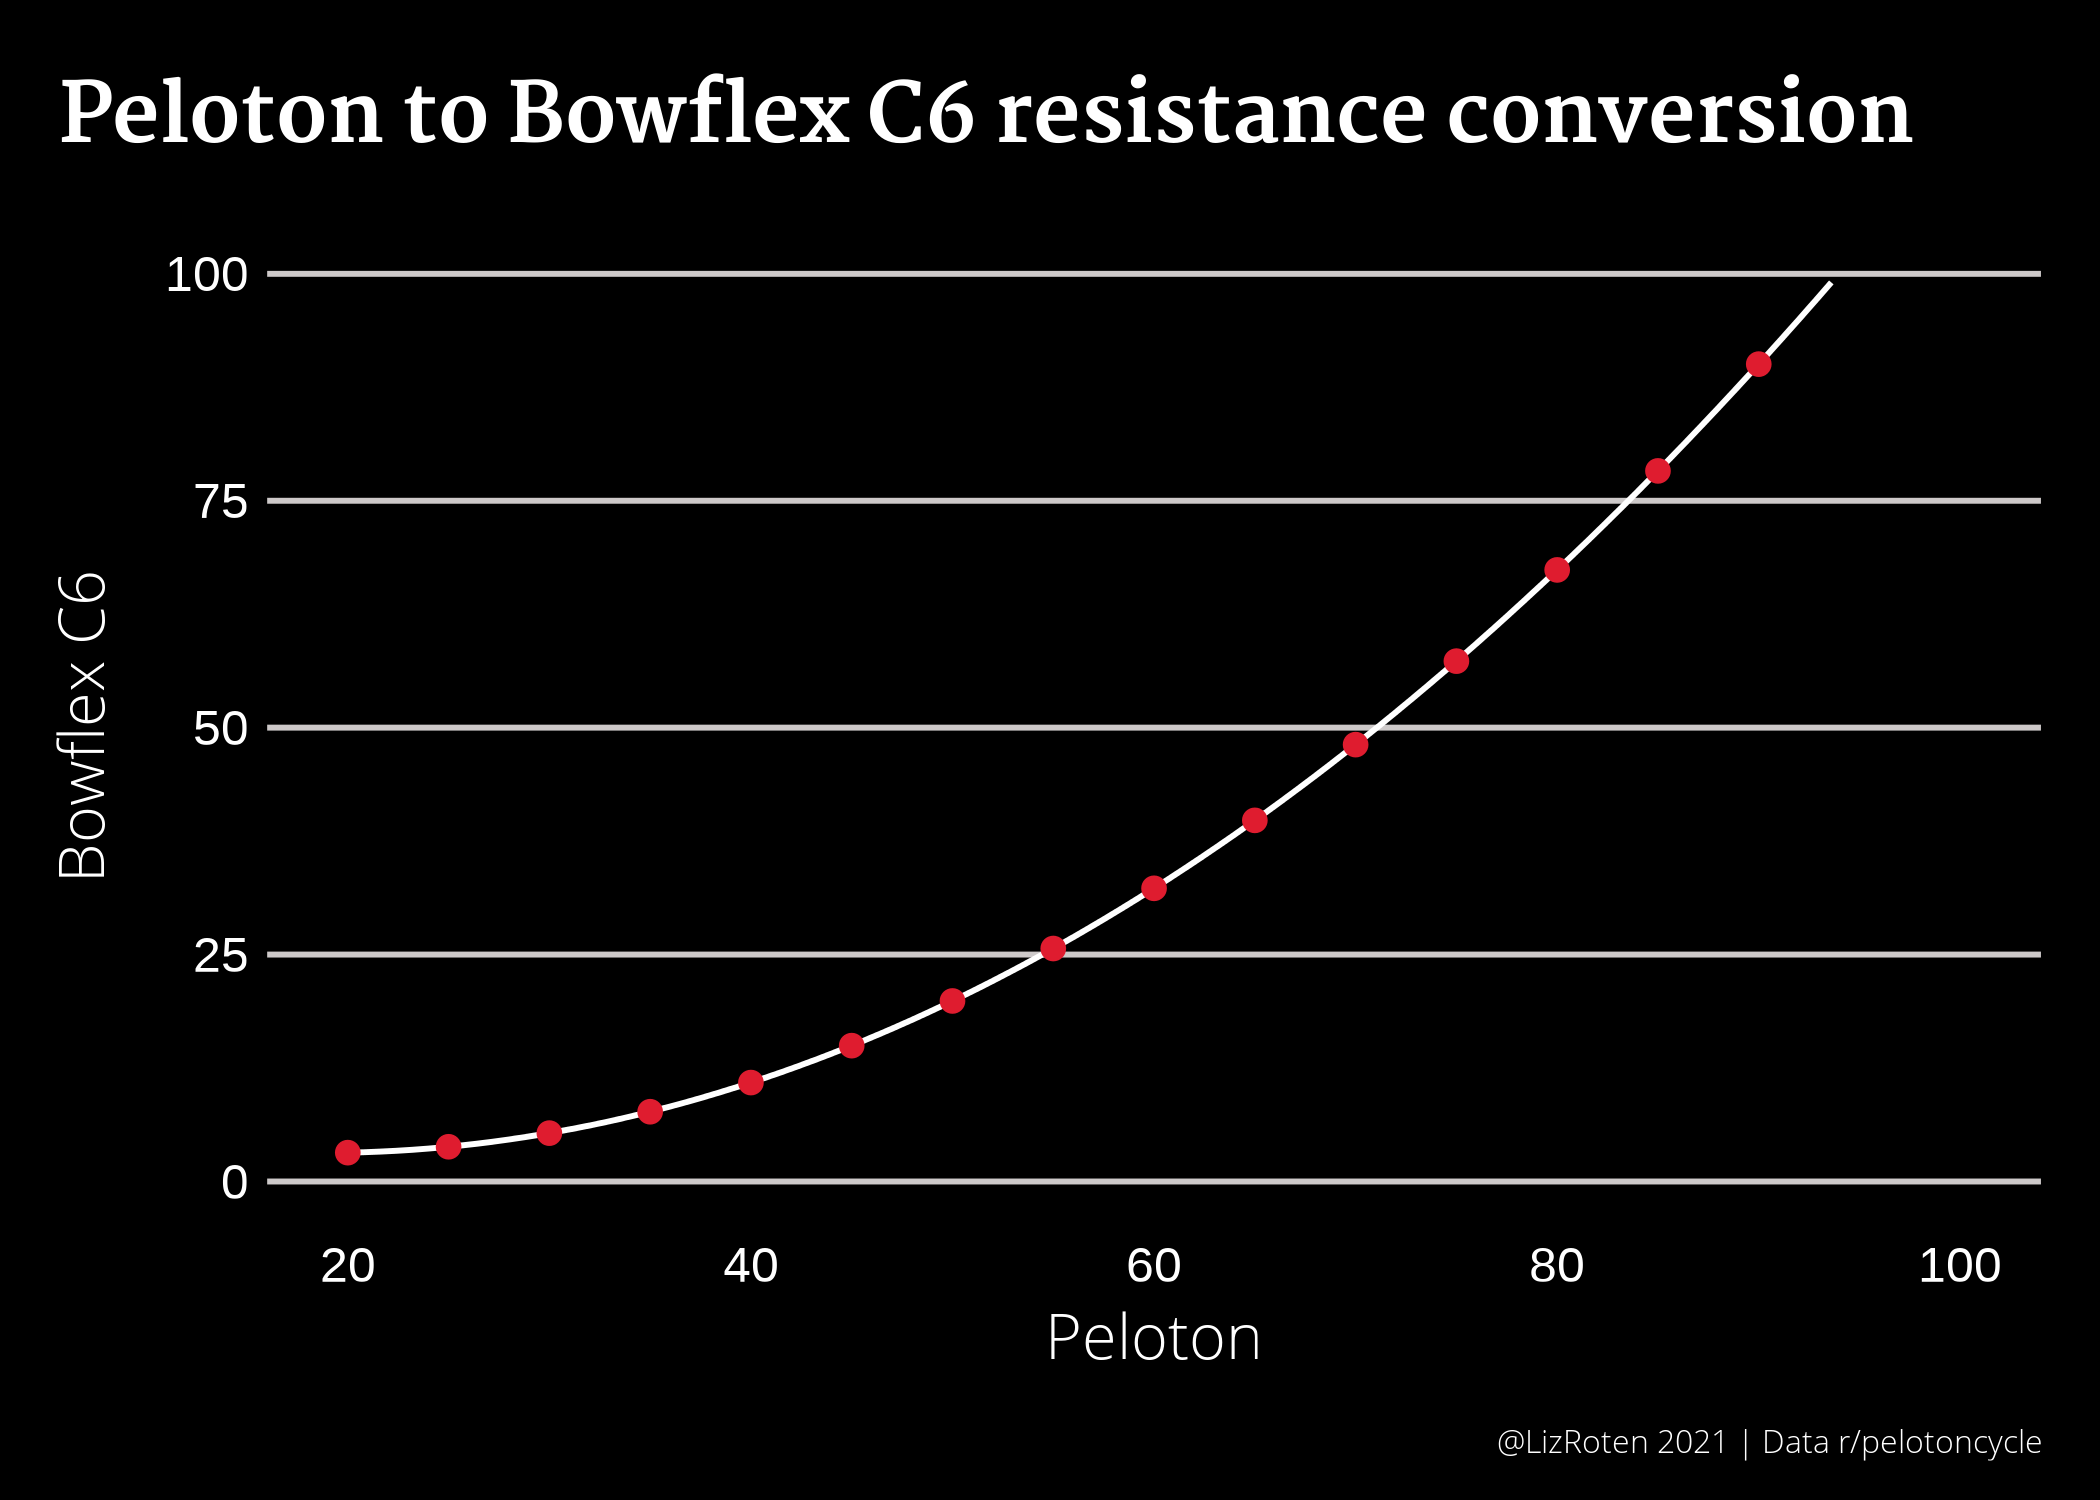
$$ y = 0.0171x^2 - 0.64x + 9.1429 $$
where x is the Peloton resistance and y is the C6 resistance.
pelo_conversion <- function(x){
  (0.0171*x^2) - (0.64*x) + 9.1429
}
To estimate the equivalence beyond 50, we can create a new tibble and apply the function to a sequence of Peloton resistance settings. Instructors don’t tend to call out any value below 20, so we can start there.
tibble(peloton_resistance = seq(20,100,5)) %>%  # create Peloton resistance sequence, 20-100 by 5s
  mutate(c6_resistance = round(pelo_conversion(peloton_resistance), 1))
#> # A tibble: 17 x 2
#>    peloton_resistance c6_resistance
#>                 <dbl>         <dbl>
#>  1                 20           3.2
#>  2                 25           3.8
#>  3                 30           5.3
#>  4                 35           7.7
#>  5                 40          10.9
#>  6                 45          15
#>  7                 50          19.9
#>  8                 55          25.7
#>  9                 60          32.3
#> 10                 65          39.8
#> 11                 70          48.1
#> 12                 75          57.3
#> 13                 80          67.4
#> 14                 85          78.3
#> 15                 90          90.1
#> 16                 95         103.
#> 17                100         116.
By this table, I’ve been making my classes much harder than necessary.
We can plot this function, as shown below.
ggplot(data = conv_table,
       aes(x = Peloton,
           y = C6)) +
  geom_function(
    fun = pelo_conversion,
    color = "white") +
  stat_function(
    fun = pelo_conversion,
    geom = "point",
    color = pelo_red,
    size = 2,
    n = 17) +
  scale_x_continuous(limits = c(20, 100)) +
  scale_y_continuous(limits = c(0, 100)) +
  labs(title = "Peloton to Bowflex C6 resistance conversion",
       x = "Peloton",
       y = "Bowflex C6",
       caption = "@LizRoten 2021 | Data r/pelotoncycle") +
  my_theme2
The big, flashing caveat here is that every bike is calibrated just slightly differently, so this might not be correct for the machine in my bedroom.