Radial rtistry
Generative art using ggplot2
I’ve been obsessed with Ijeamaka Anyene’s art for months now. Her zine is gorgeous, and I’ve been antsy to try some of the techniques out.
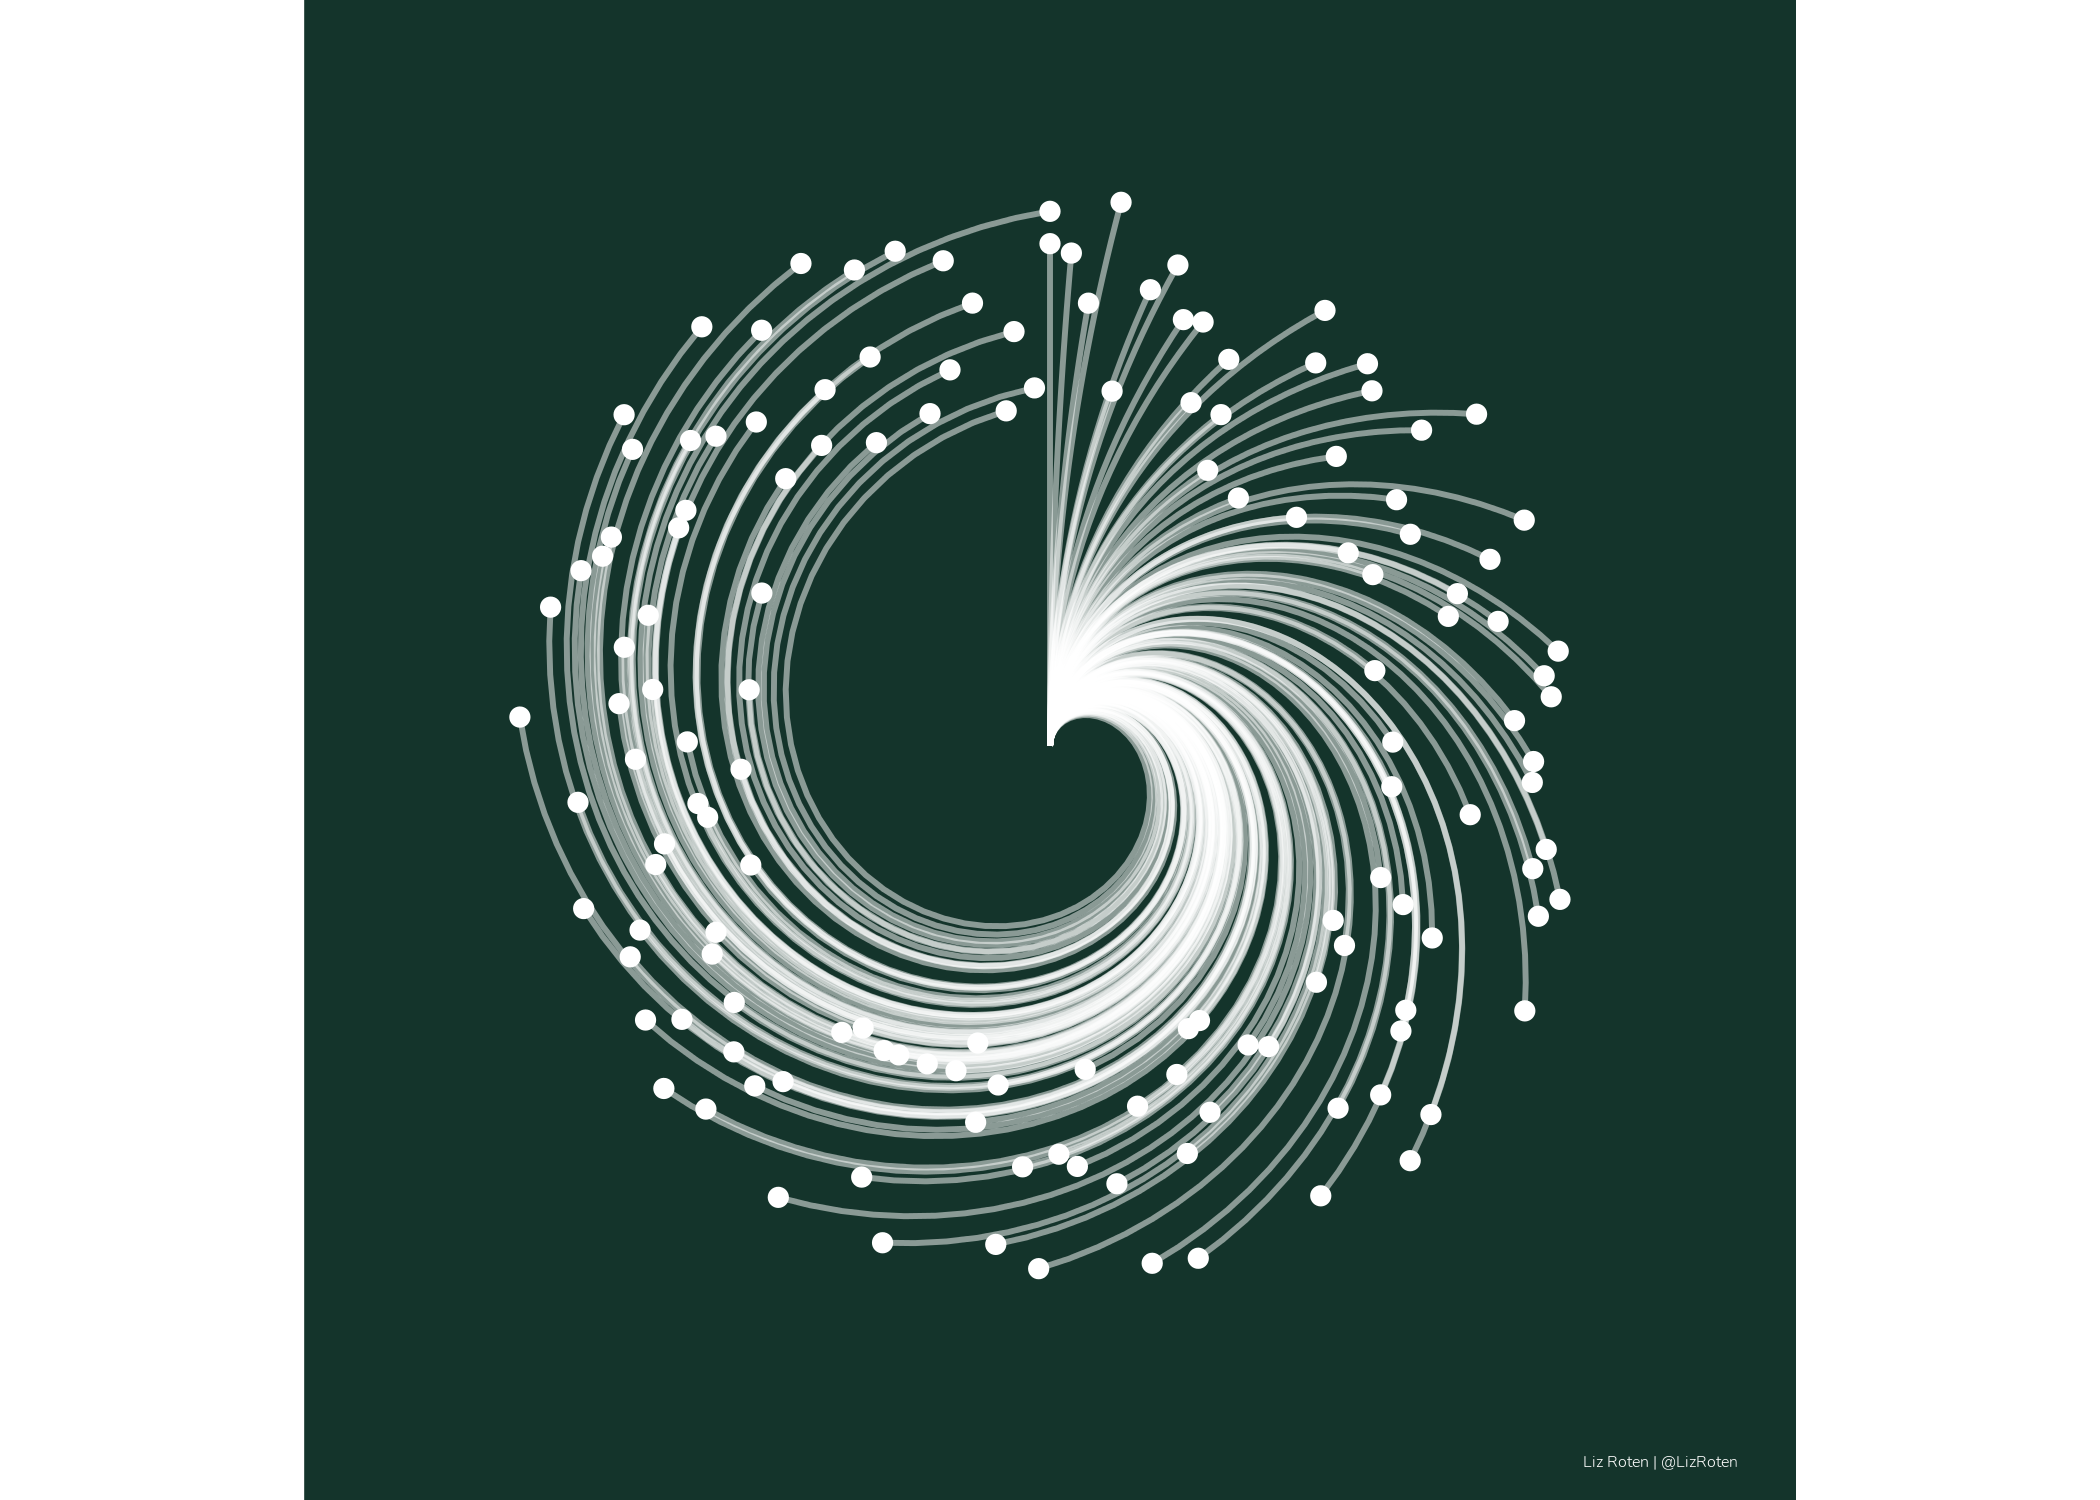
Spokes: Pattern 01 Variants
# setup
library(tidyverse)
library(colorspace)
set.seed(246153)

library(showtext)
showtext_auto()
file <- sysfonts::font_files()

font_add("Nunito Light", "Nunito-Light.ttf")
font_add("Cormorant Garamond", "CormorantGaramond-Regular.ttf")

my_caption <- "Liz Roten | @LizRoten"
See original here.
lines <- tibble(
  x = seq(0, 29, by = 0.2),
  xend = rep(0,146),
  y = runif(146, min = 5, max = 9),
  yend = rep(0,146),
  speed = 3
)


ggplot() +
  geom_segment(data = lines,
               aes(x = x,
                   y = y,
                   xend = xend,
                   yend = yend),
               color = "white",
               alpha = 0.5) +
  geom_point(data = lines,
             aes(x = x,
                 y = y),
             color = "white") +
  coord_polar() +
  scale_x_continuous(limits = c(0, 29)) +
  # scale_y_continuous(limits = c(-1, 10)) +
  labs(caption = my_caption) +
  theme_void() +
  theme(plot.background = element_rect(fill = "#14342B",
                                       color = NA),
        panel.background = element_rect(fill = "#14342B",
                                        color = NA),
        plot.caption = element_text(family = "Nunito Light",
                                    color = "white",
                                    size = 12),
        plot.margin = unit(c(.5, .5, .2, .5), "cm")
  )
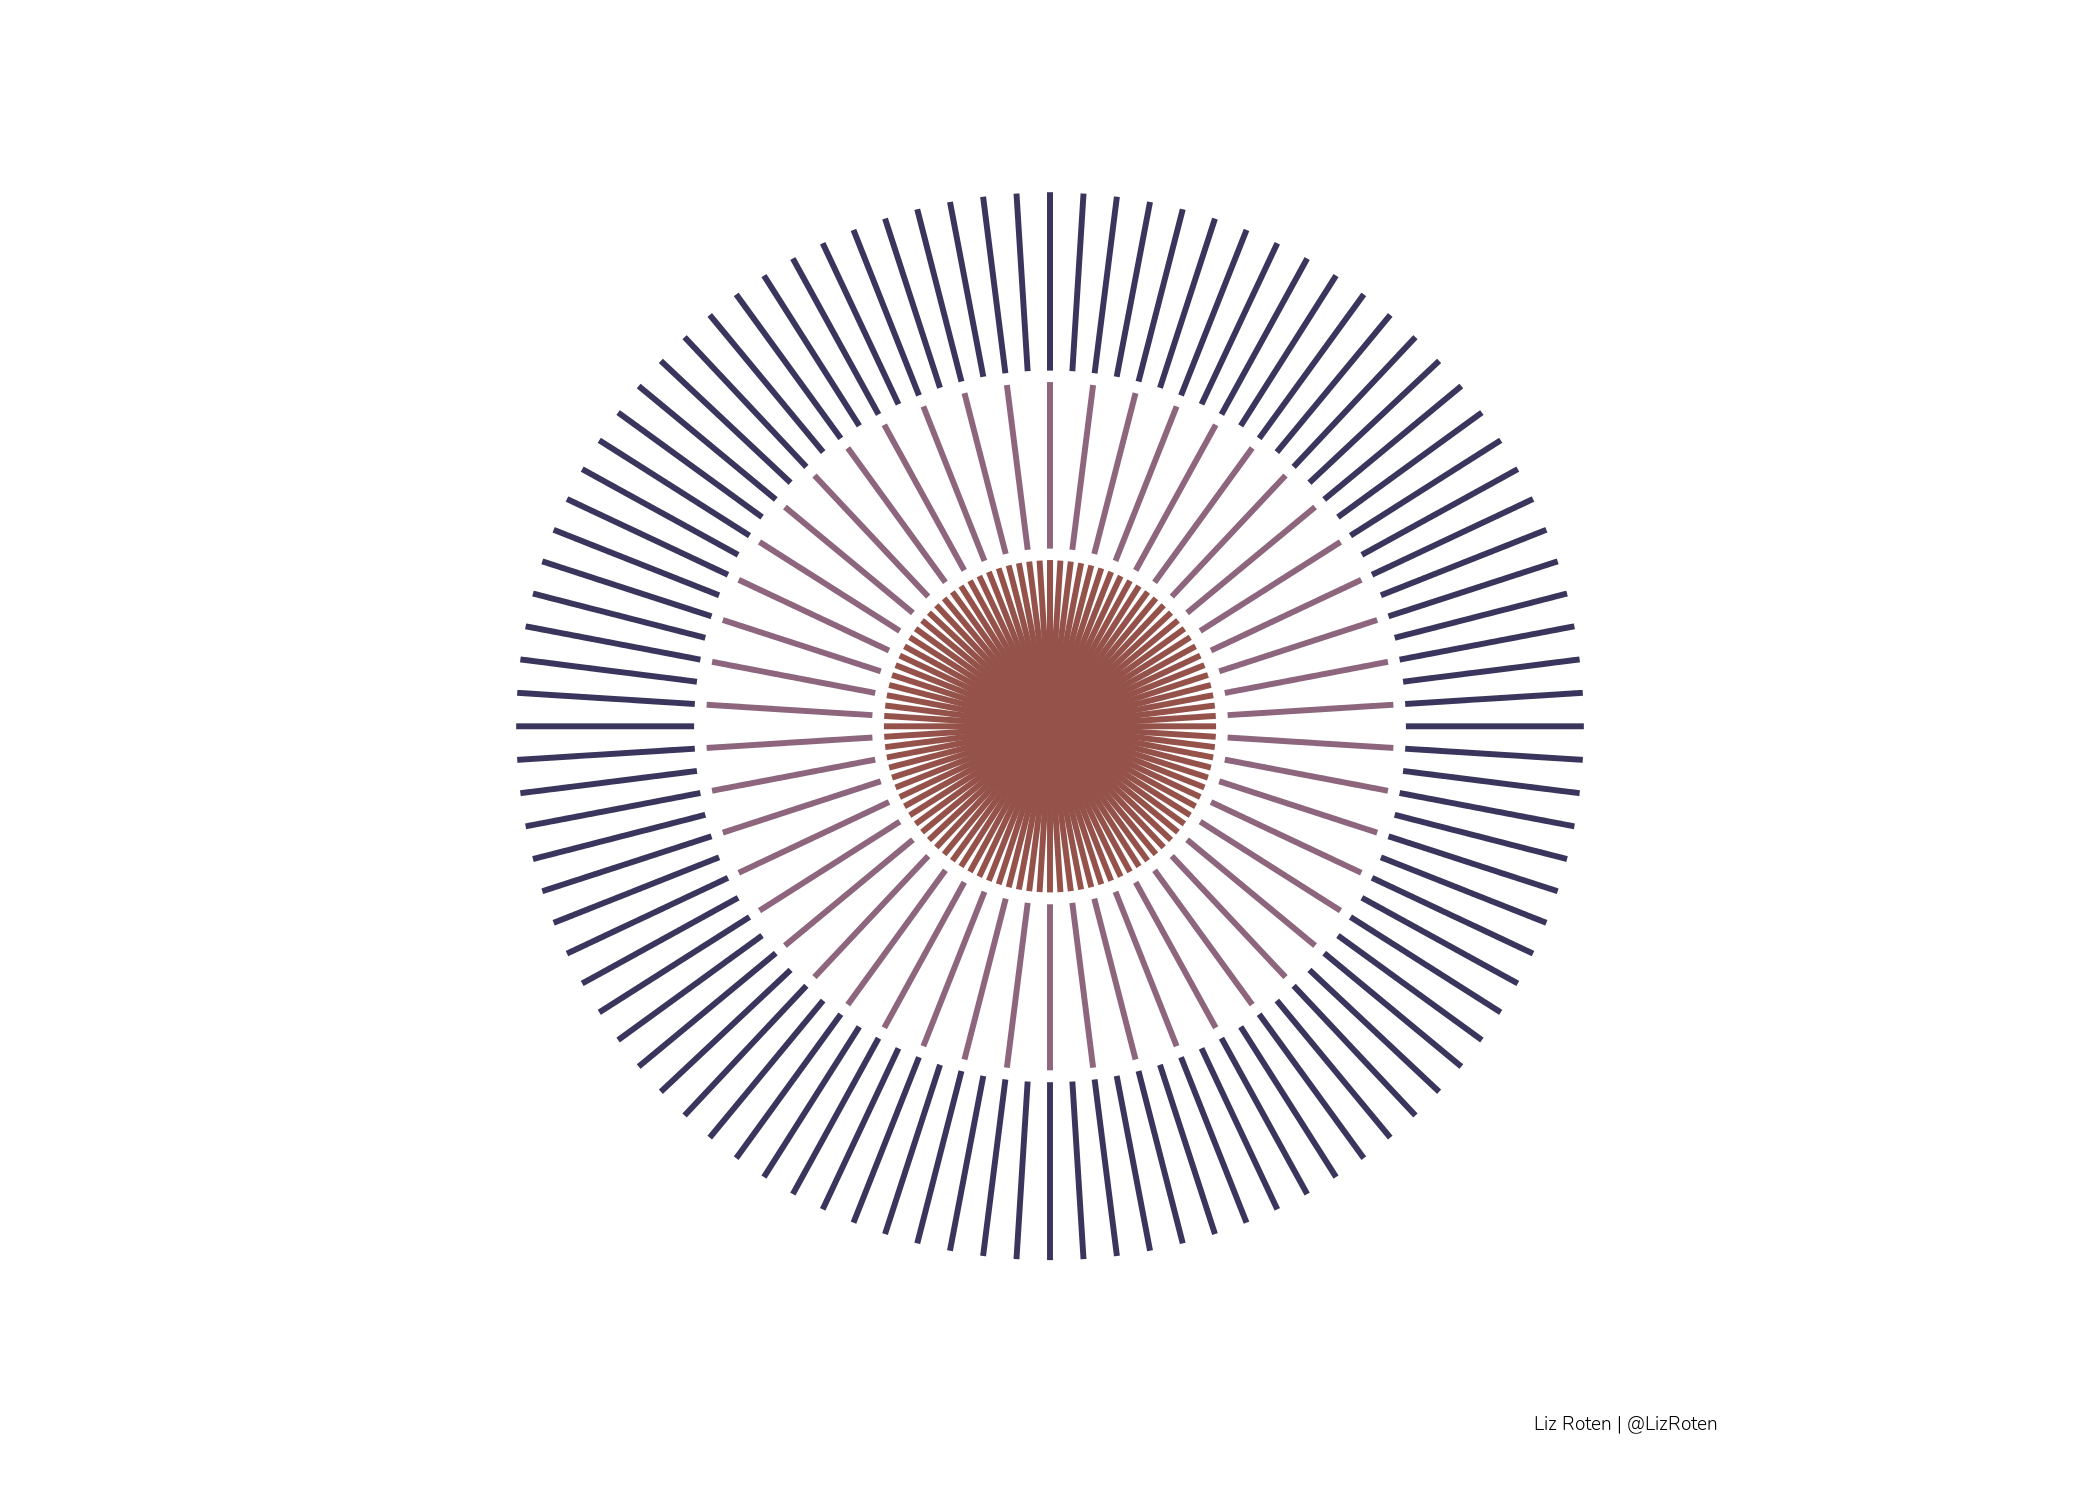
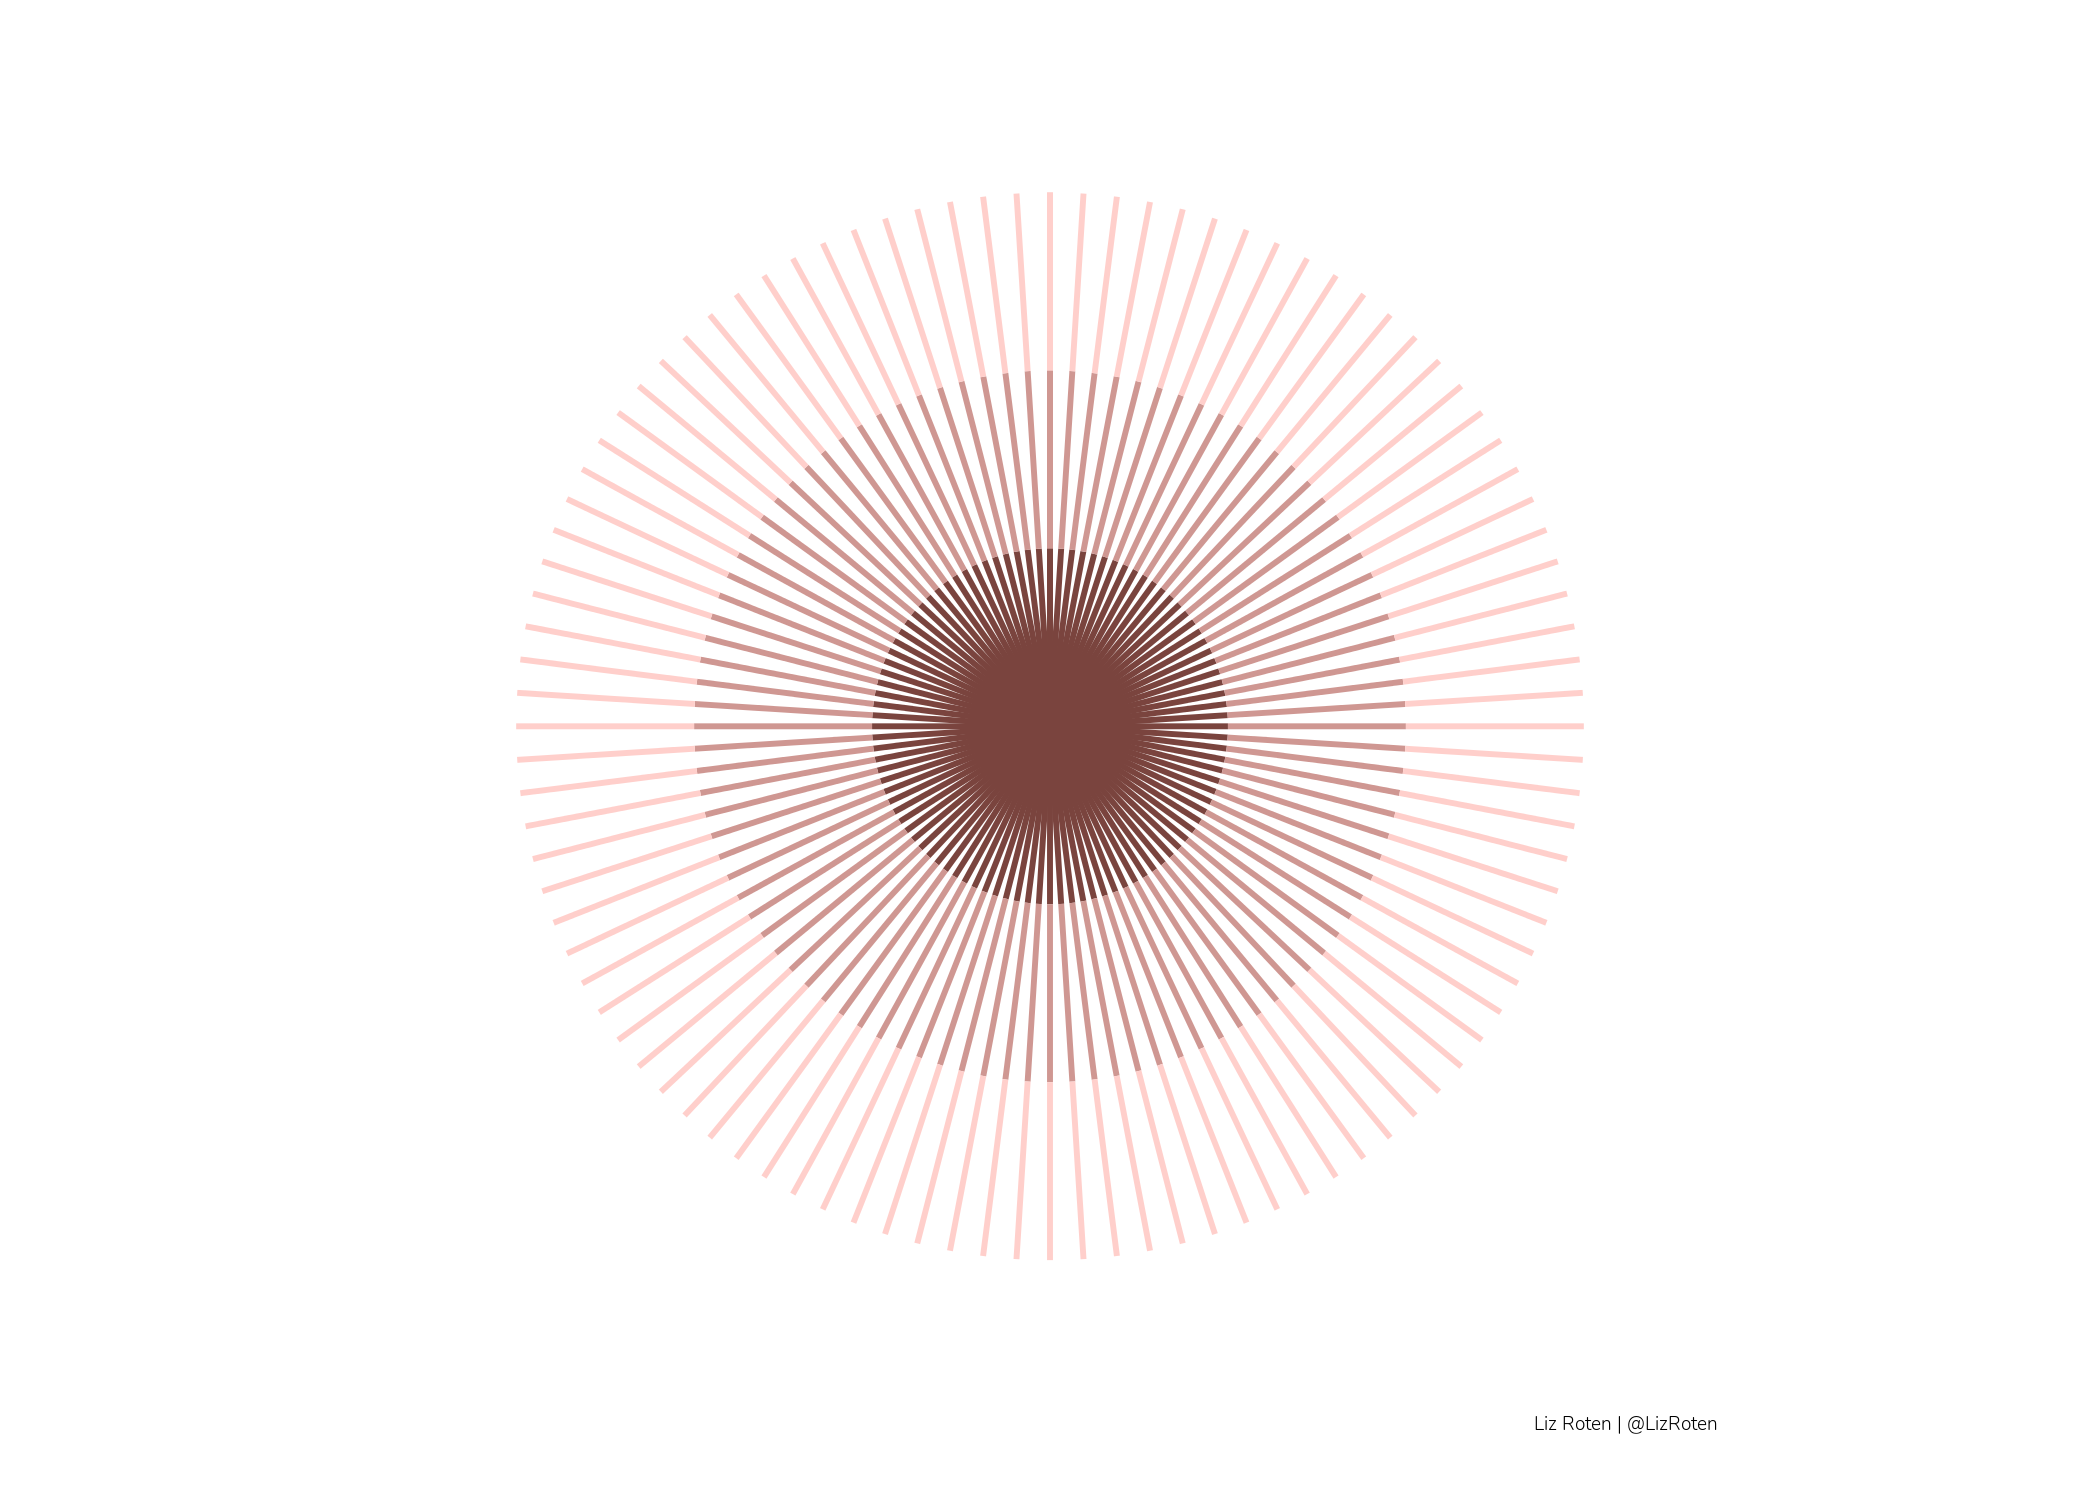
Spokes: Pattern 10 Variants
See original here.
increment = .05

circle_1 = tibble(
  x = seq(from = 0, to = 5, by = increment),
  xend = seq(from = 0, to = 5, by = increment),
  y = 0,
  yend = 1.4,
  type = LETTERS[1])

circle_2 = tibble(
  x = seq(from = 0, to = 5, by = increment  + increment),
  xend = seq(from = 0, to = 5, by = increment + increment),
  y = 1.5,
  yend = 2.9,
  type = LETTERS[2])

circle_3 = tibble(
  x = seq(from = 0, to = 5, by = increment ),
  xend = seq(from = 0, to = 5, by = increment  ),
  y = 3,
  yend = 4.5,
  type = LETTERS[3])

palette_values = c("#94524A", "#8d667e", "#39355c")


bind_rows(circle_1, circle_2, circle_3) %>%
  ggplot(.) +
  geom_segment(aes(x = x,
                   y = y,
                   xend = xend,
                   yend = yend,
                   color = type),
               show.legend = F) +
  scale_color_manual(values = palette_values) +
  labs(caption = my_caption) +
  coord_polar() +
  theme_void() +
    theme(
      # plot.background = element_rect(fill = "#565254",
      #                                  color = NA,
      #                                  size = 0),
      #   panel.background = element_rect(fill = "#565254",
      #                                   color = NA,
      #                                   size = 0),
        plot.caption = element_text(family = "Nunito Light",
                                    color = "black",
                                    hjust = 1,
                                    size = 14),
        plot.caption.position = "plot",
        plot.margin = unit(c(.5, .5, .5, .5), "cm")
  )
increment = .05

circle_1 = tibble(
  x = seq(from = 0, to = 5, by = increment),
  xend = seq(from = 0, to = 5, by = increment),
  y = 0,
  yend = 1.5,
  type = LETTERS[1])

circle_2 = tibble(
  x = seq(from = 0, to = 5, by = increment),
  xend = seq(from = 0, to = 5, by = increment),
  y = 1.5,
  yend = 3,
  type = LETTERS[2])

circle_3 = tibble(
  x = seq(from = 0, to = 5, by = increment ),
  xend = seq(from = 0, to = 5, by = increment  ),
  y = 3,
  yend = 4.5,
  type = LETTERS[3])

palette_values = c("#7A443E",
                   colorspace::lighten("#7A443E", 0.5),
                   colorspace::lighten("#7A443E", 0.8))

bind_rows(circle_1, circle_2, circle_3) %>%
  ggplot(.) +
  geom_segment(aes(x = x,
                   y = y,
                   xend = xend,
                   yend = yend,
                   color = type),
               show.legend = F) +
  scale_color_manual(values = palette_values) +
  labs(caption = my_caption) +
  coord_polar() +
  theme_void() +
    theme(
        plot.caption = element_text(family = "Nunito Light",
                                    color = "black",
                                    hjust = 1,
                                    size = 14),
        plot.caption.position = "plot",
        plot.margin = unit(c(.5, .5, .5, .5), "cm")
  )
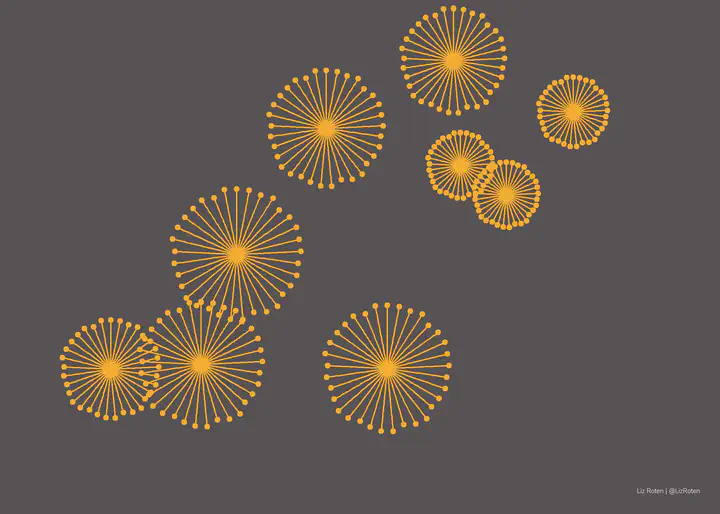
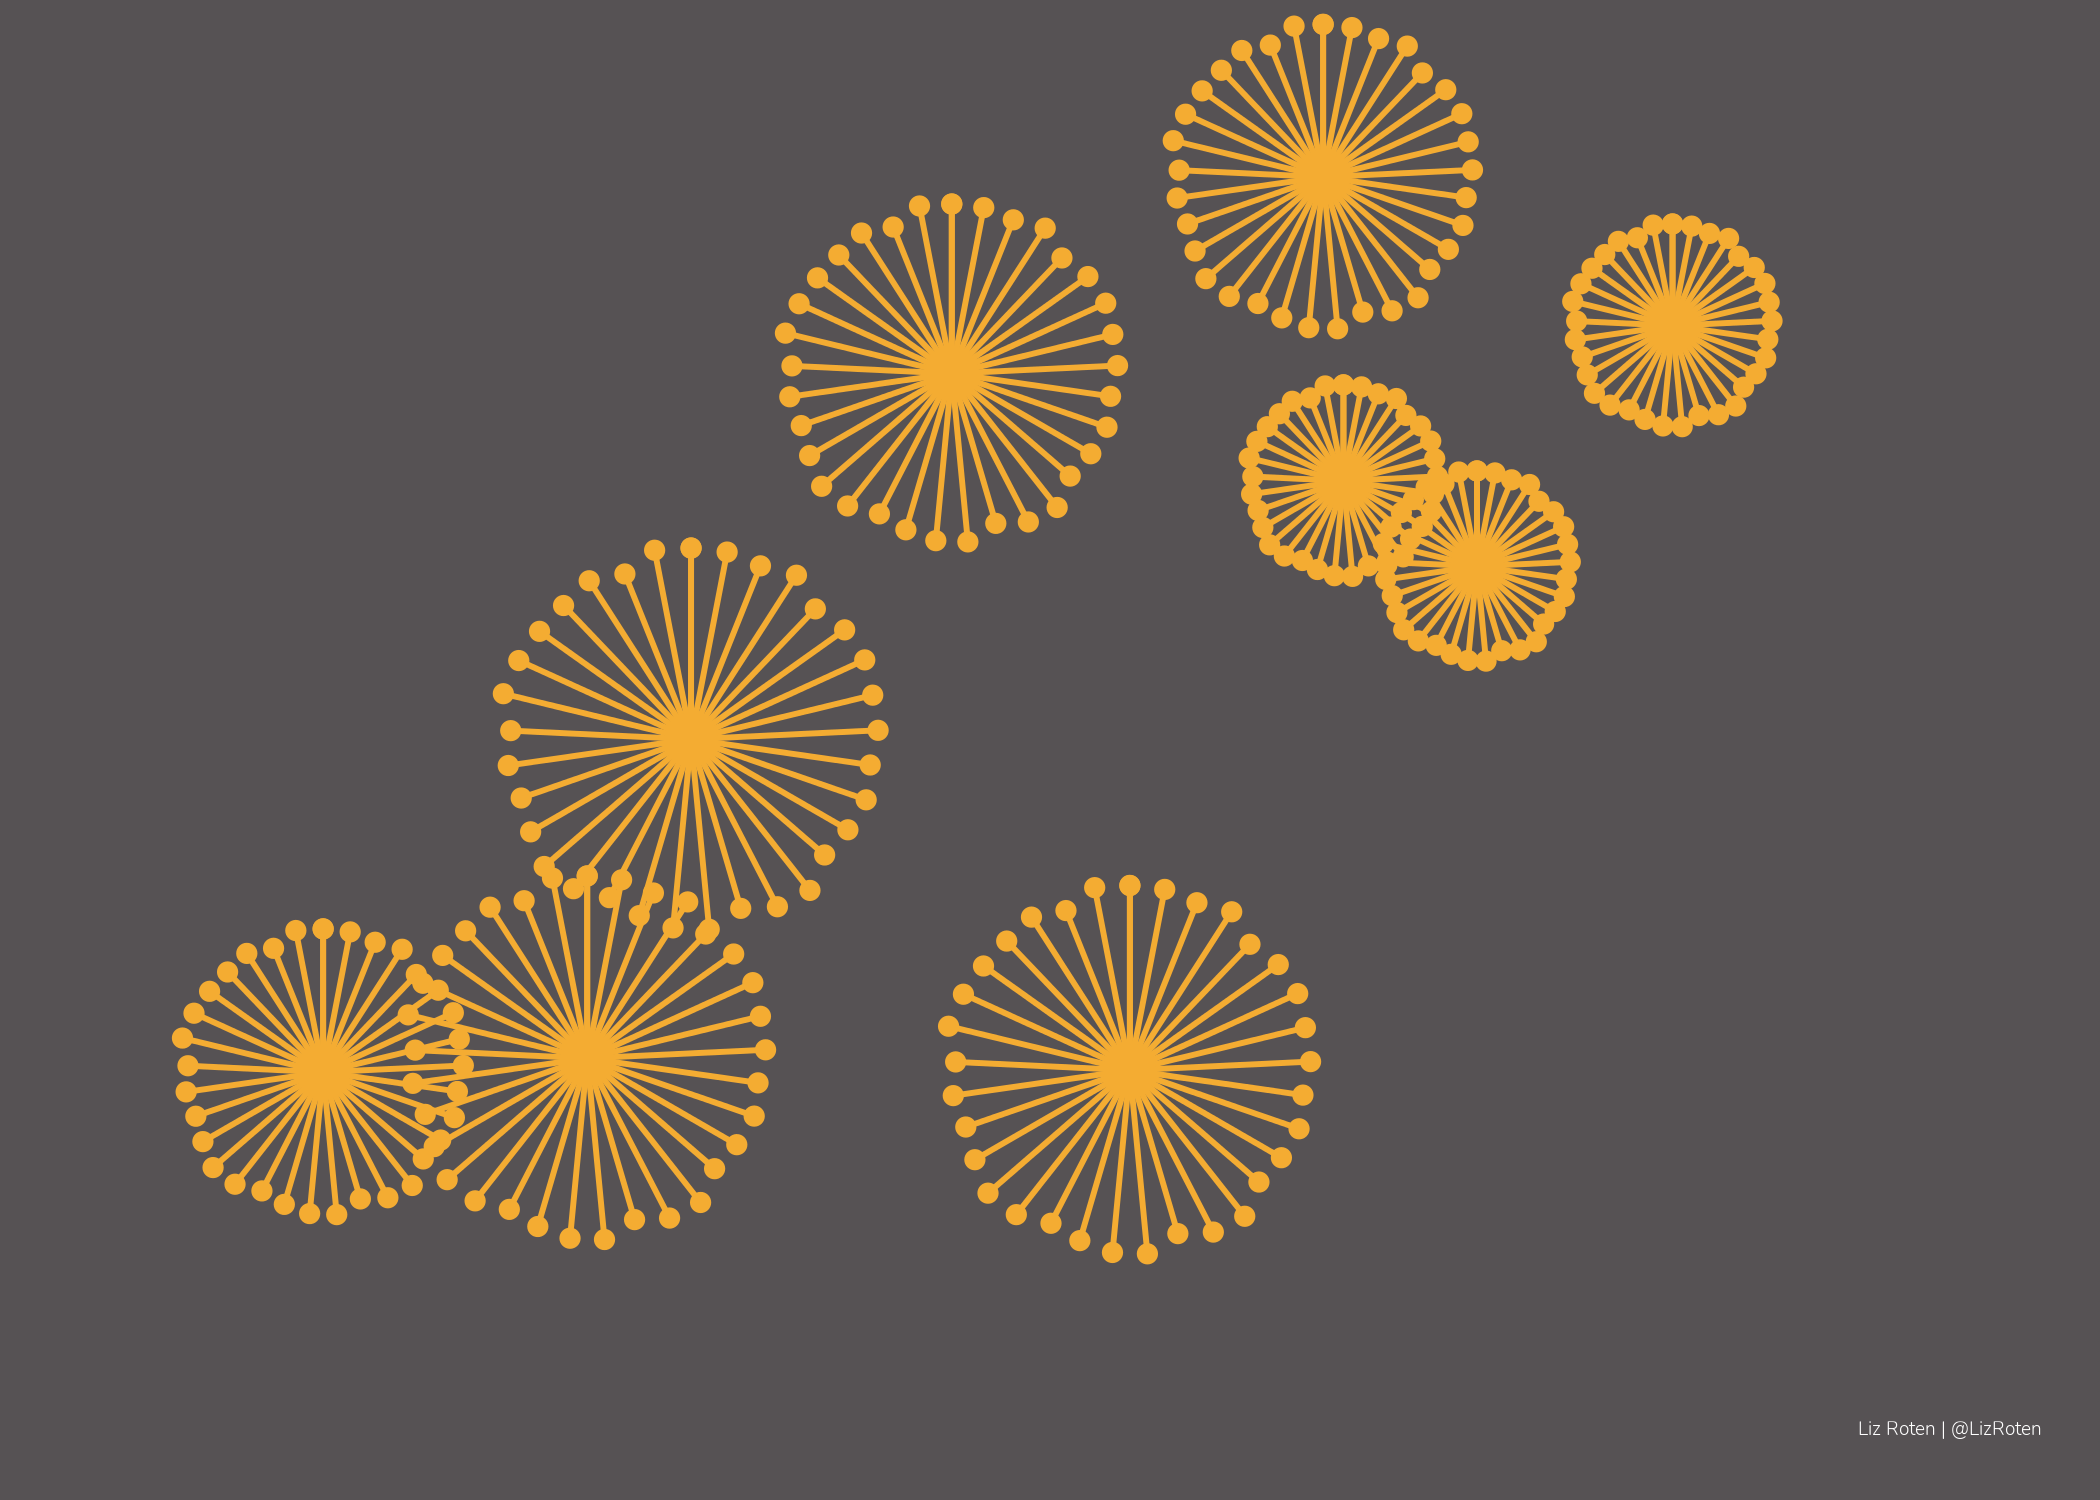
Florals
I fell in love with the opening slide in Ijeamaka Anyene’s talk at RLadies Johannesburg, so I wanted to give it a try!
set.seed(246153)

burst <- tibble(
  x = seq(0, 10, by = 0.3),
  xend = seq(0,10, by = 0.3),
  y =  0,
  yend = 0.4,
  yend_jitt = jitter(yend, 2.6),
  yend_jitt_point = yend_jitt

)


plot_burst <- ggplot() +
  geom_segment(data = burst,
               aes(x = x,
                   y = y,
                   xend = xend,
                   yend = yend_jitt),
               color = "#F4AC32",
               lwd = 0.5) +
  geom_point(data = burst,
             aes(x = x,
                 y = yend_jitt),
             color = "#F4AC32",
             size = 1.5
  ) +
  coord_polar() +
  theme_void()

bursts <- quote(expr = {cowplot::draw_plot(plot_burst,
                                           scale = runif(1, min = 1.2, max = 3),
                                           x = runif(1, min = 0, max = 10),
                                           y = runif(1, min = 0, max = 5))})


plot_all <- cowplot::ggdraw(xlim = c(0,12),
                            ylim = c(0,6)) +
  eval(bursts) +
  eval(bursts) +
  eval(bursts) +
  eval(bursts) +
  eval(bursts) +
  eval(bursts) +
  eval(bursts) +
  eval(bursts) +
  eval(bursts) +
  labs(caption = my_caption) +
  theme(plot.background = element_rect(fill = "#565254",
                                       color = NA,
                                       size = 0),
        panel.background = element_rect(fill = "#565254",
                                        color = NA,
                                        size = 0),
        plot.caption = element_text(family = "Nunito Light",
                                    color = "white",
                                    hjust = 1,
                                    size = 14),
        plot.caption.position = "plot",
        plot.margin = unit(c(.5, .5, .5, .5), "cm")
  )

plot_all
See also
- Ijeamaka Anyene’s fantastic zine
- Colors via https://coolors.co/