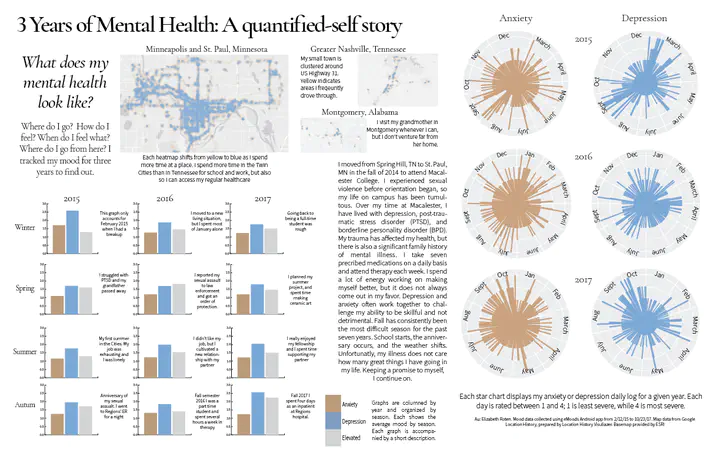
3 Years of Mental Health: A quantified-self story
Mapping my travel patterns and mental health from 2015-2017
 Liz Roten, 2017
About the Process
I use eMoods to track my mental health from day to day. For this viz, I used eMoods data, as well as my Google Location History data, to display my life between February 2015 and October 2017. I used ggplot2 in R Studio to generate the radial bar charts on the far rights, and Adobe Illustrator to construct the bar graphs in the bottom left corner. For the heatmaps, I first attempted to use ArcGIS to view data I downloaded from my Google account directly but quickly found that software to be limiting for the goals of this project I forked and modified Location History Visualizer using JavaScript, HTML, and CSS to use my own color scheme and preferred base map. I assembled the images in Adobe Illustrator and presented this work for my class.
I worked with geospatial data in formats I was unfamiliar with, such as KML, JSON, and tar.gz zipped files. I also had no prior experience in Adobe Illustrator, JavaScript, HTML, and CSS. This piece not only demonstrates my skill in these areas but also my persistence and commitment to telling my story.
During my Spring 2018 independent project, I also used R Shiny to take a simple, interactive look at the polar coordinate bar graphs. You can see this app on its own here and the updated version here.