Regional Truck Corridor Study
 Liz Roten for Metropolitan Council, 2022
The study update process began in 2021 with a few goals.
- Migrate existing calculations and documentation scattered in Excel workbooks, ArcGIS documents, and PDFs to reproducible R code and RMarkdown documents, complete with version control and testing.
- Re-score existing corridors using most recent available data.
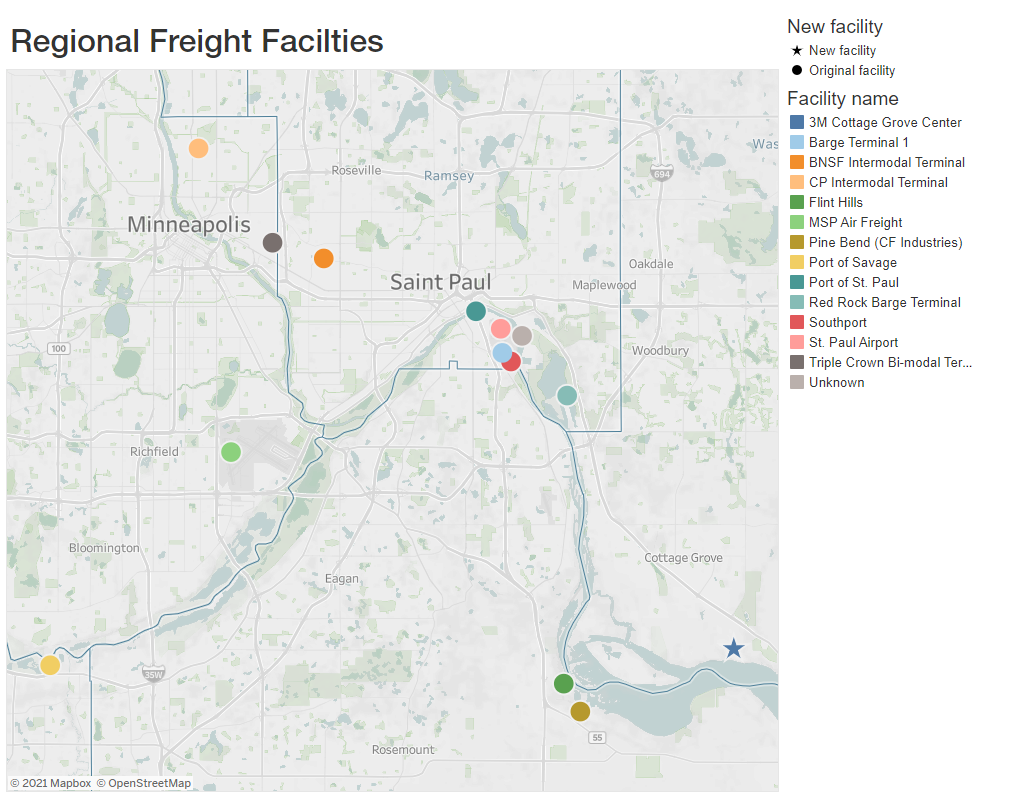
- Evaluate new truck corridors and freight facilities as submitted by agency partners.
Throughout the process, I carefully balanced preserving the original methodology and accounting for each data source’s quirks.
Some data used in the original study were unavailable. Working with our transportation planners, I developed a method for estimating truck volume and truck percentage of total traffic using StreetLight Data. I then carefully integrated the data sources and patched missing data to complete the project. Finally, I completed an comprehensive project wrap-up, tracking down emails, chat messages, and meeting notes to compile a definitive “how” and “why” for each data source and analysis method. I used {groundhog} to preserve package versions and implemented a clever script naming convention to organize files. Documentation is a love letter to your future self - and I went all out.
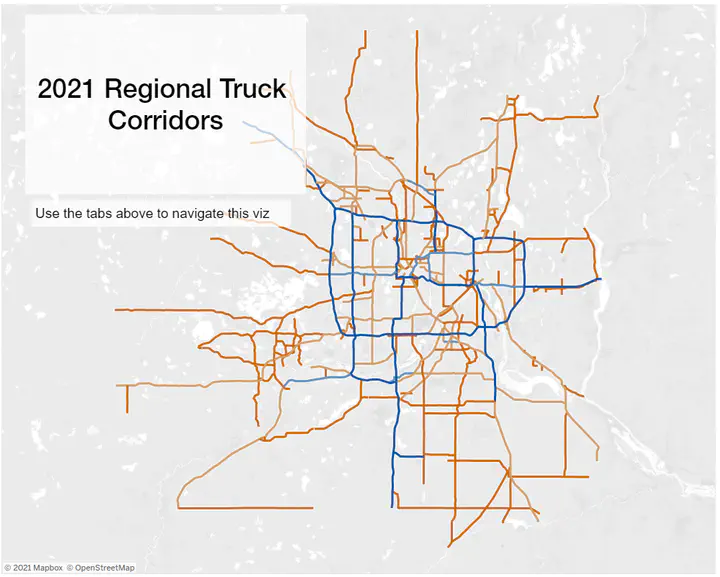
Interactive
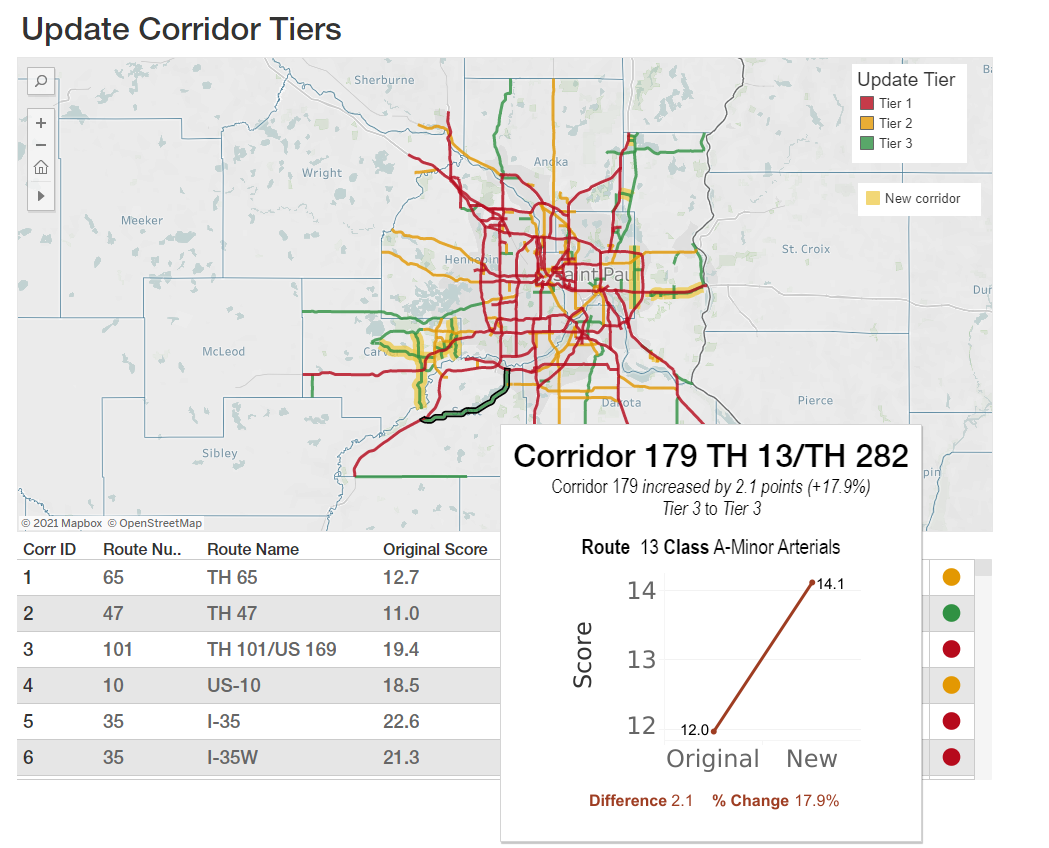
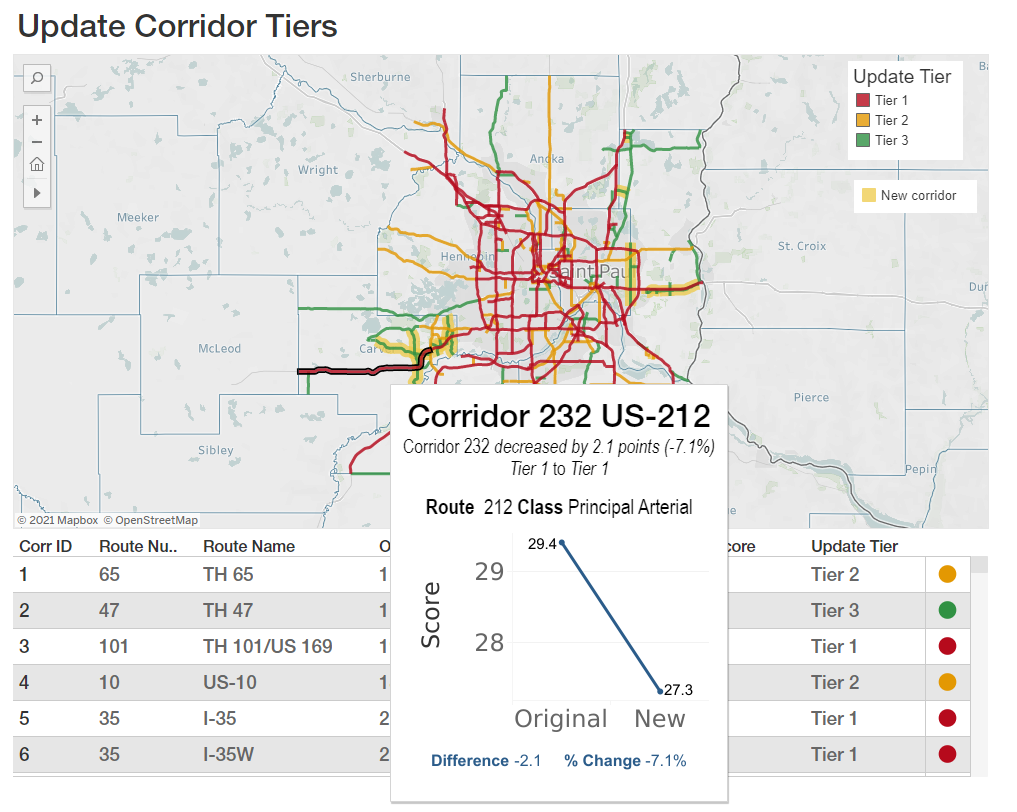
I decided to build the visualization using Tableau because I wanted to take advantage of Tableau’s dynamic tooltips, in which you can insert a mini plot. The interaction between elements, such as a map and a table, is more streamlined. Tableau can also turn out a snazzy visualization relatively quickly.
Screenshots
Background
Regional truck freight corridors were initially developed through the 2017 Regional Truck Highway Corridors Study. A technical advisory work group of public agency staff most directly engaged in highway planning guided this data-driven study that analyzed the region’s principal and minor arterials. Ultimately the study applied four data factors to establish corridor score rankings and to group the corridors into tiers 1, 2, and 3, in order of priority.
In 2018 the Met Council adopted the study’s final regional truck corridors into the Transportation Policy Plan and first applied the tiered corridors as project selection criteria in the Regional Solicitation process for distributing federal transportation funds. The corridors have also been used as qualifying criteria in recent funding cycles of MnDOT’s Minnesota Highway Freight Program.