Como Regional Park Hex Grid StreetLight Analysis
 Liz Roten for Metropolitan Council, 2019
Summary
To better understand activity within Como Regional Park and how that activity shifts with the seasons, I created a hexagon grid over the park and then used aggregated and anonymized location-based services data provided by StreetLight Data to measure relative activity in each hexagon.
This project was my first endeavor with Tableau and was used as a pilot before we dedicated additional resources to using StreetLight Data for parks research.
Details
StreetLight Data
Data in this data visualization comes from StreetLight, an independent data provider which cleans, processes and assimilates millions of spatial data points from a combination of mobile phone Location-Based Services (LBS) data and GPS data. The data is anonymized, aggregated, and accessed only through specific analyses.
This viz draws on LBS data. Cell phone apps that use LBS collect the device’s location in space and time. StreetLight detects trips, a movement with clear start and stop locations. StreetLight uses trips to create the StreetLight Traffic Index, which is a normalized measure of the relative traffic, or activity, in an area. The data’s spatial precision is 65ft or better and StreetLight estimates a 23% penetration rate for the combined US and Canada adult population.
Analysis
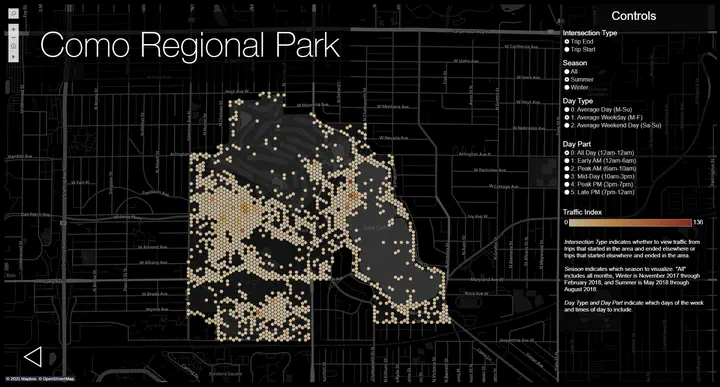
For this viz, we made a hexagon grid over Como Regional Park. We then ran a StreetLight analysis to measure the relative traffic in each hexagon and repeated the analysis for Winter (November 2017 - February 2018), Summer (May 2018 - August 2018), and all 2018. StreetLight returns a Traffic Index value for each hexagon for every trip intersection type, day type, and day part configuration.
Interactive Map
In the Tableau viz, you can view the analysis results. Each hexagon on the map changes color according to its Traffic Index, or activity level. The darker the color, the higher the traffic. You can view the exact Traffic Index value of any hexagon by hovering over it. Use the map tools in the upper left corner to pan, zoom, and adjust the map view. We suggest you view this story in full screen for the best display.