COVID-19 Surveillance at the Metro Plant
 Metropolitan Council, 2022
Background
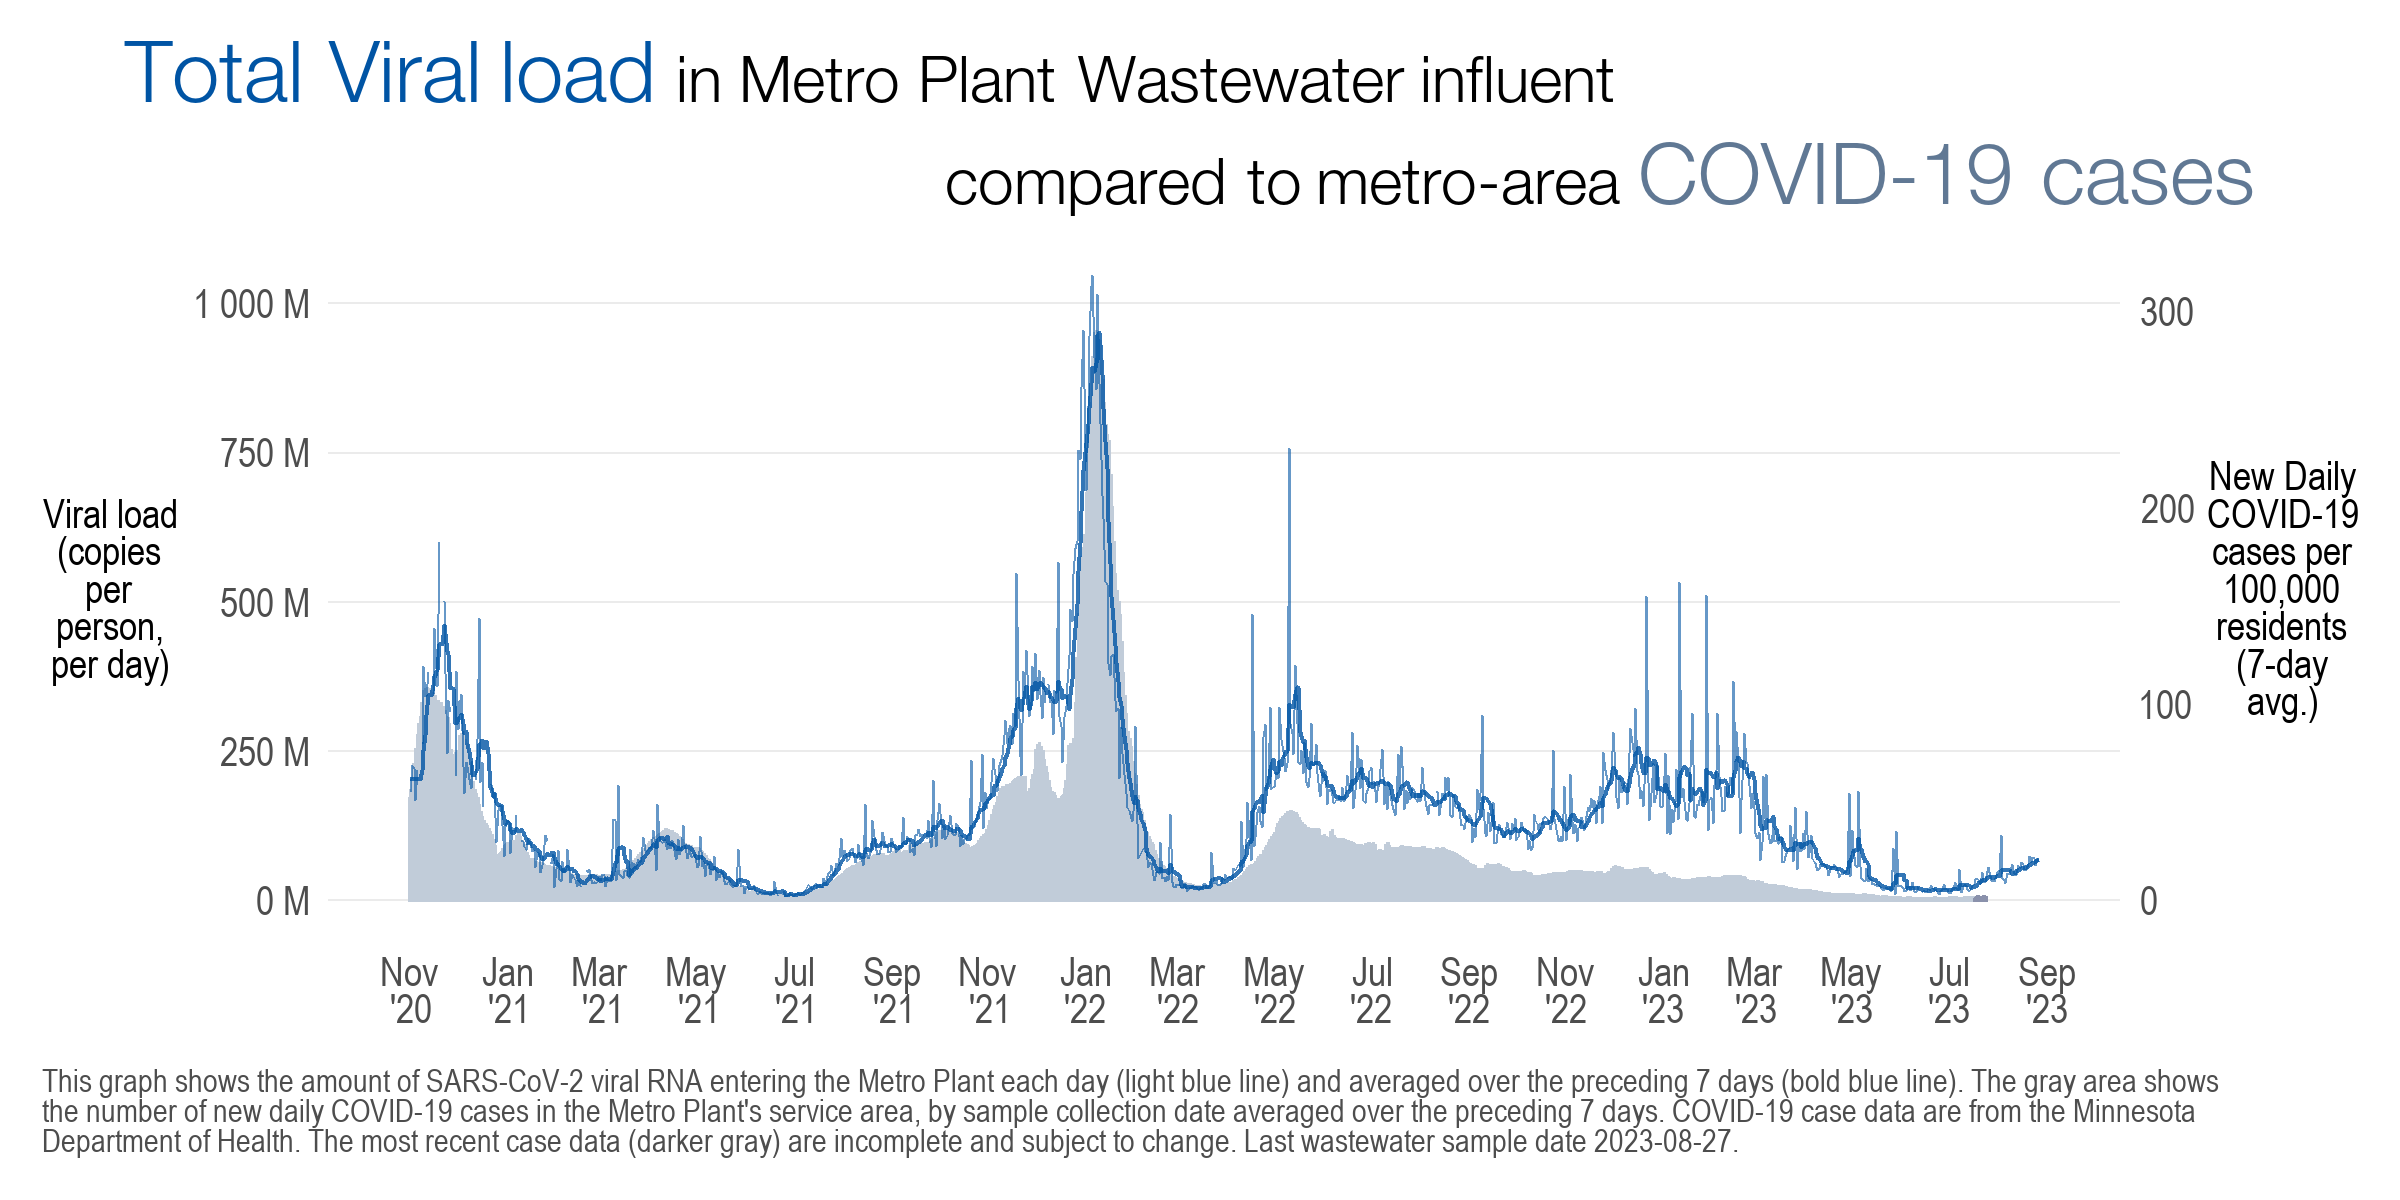
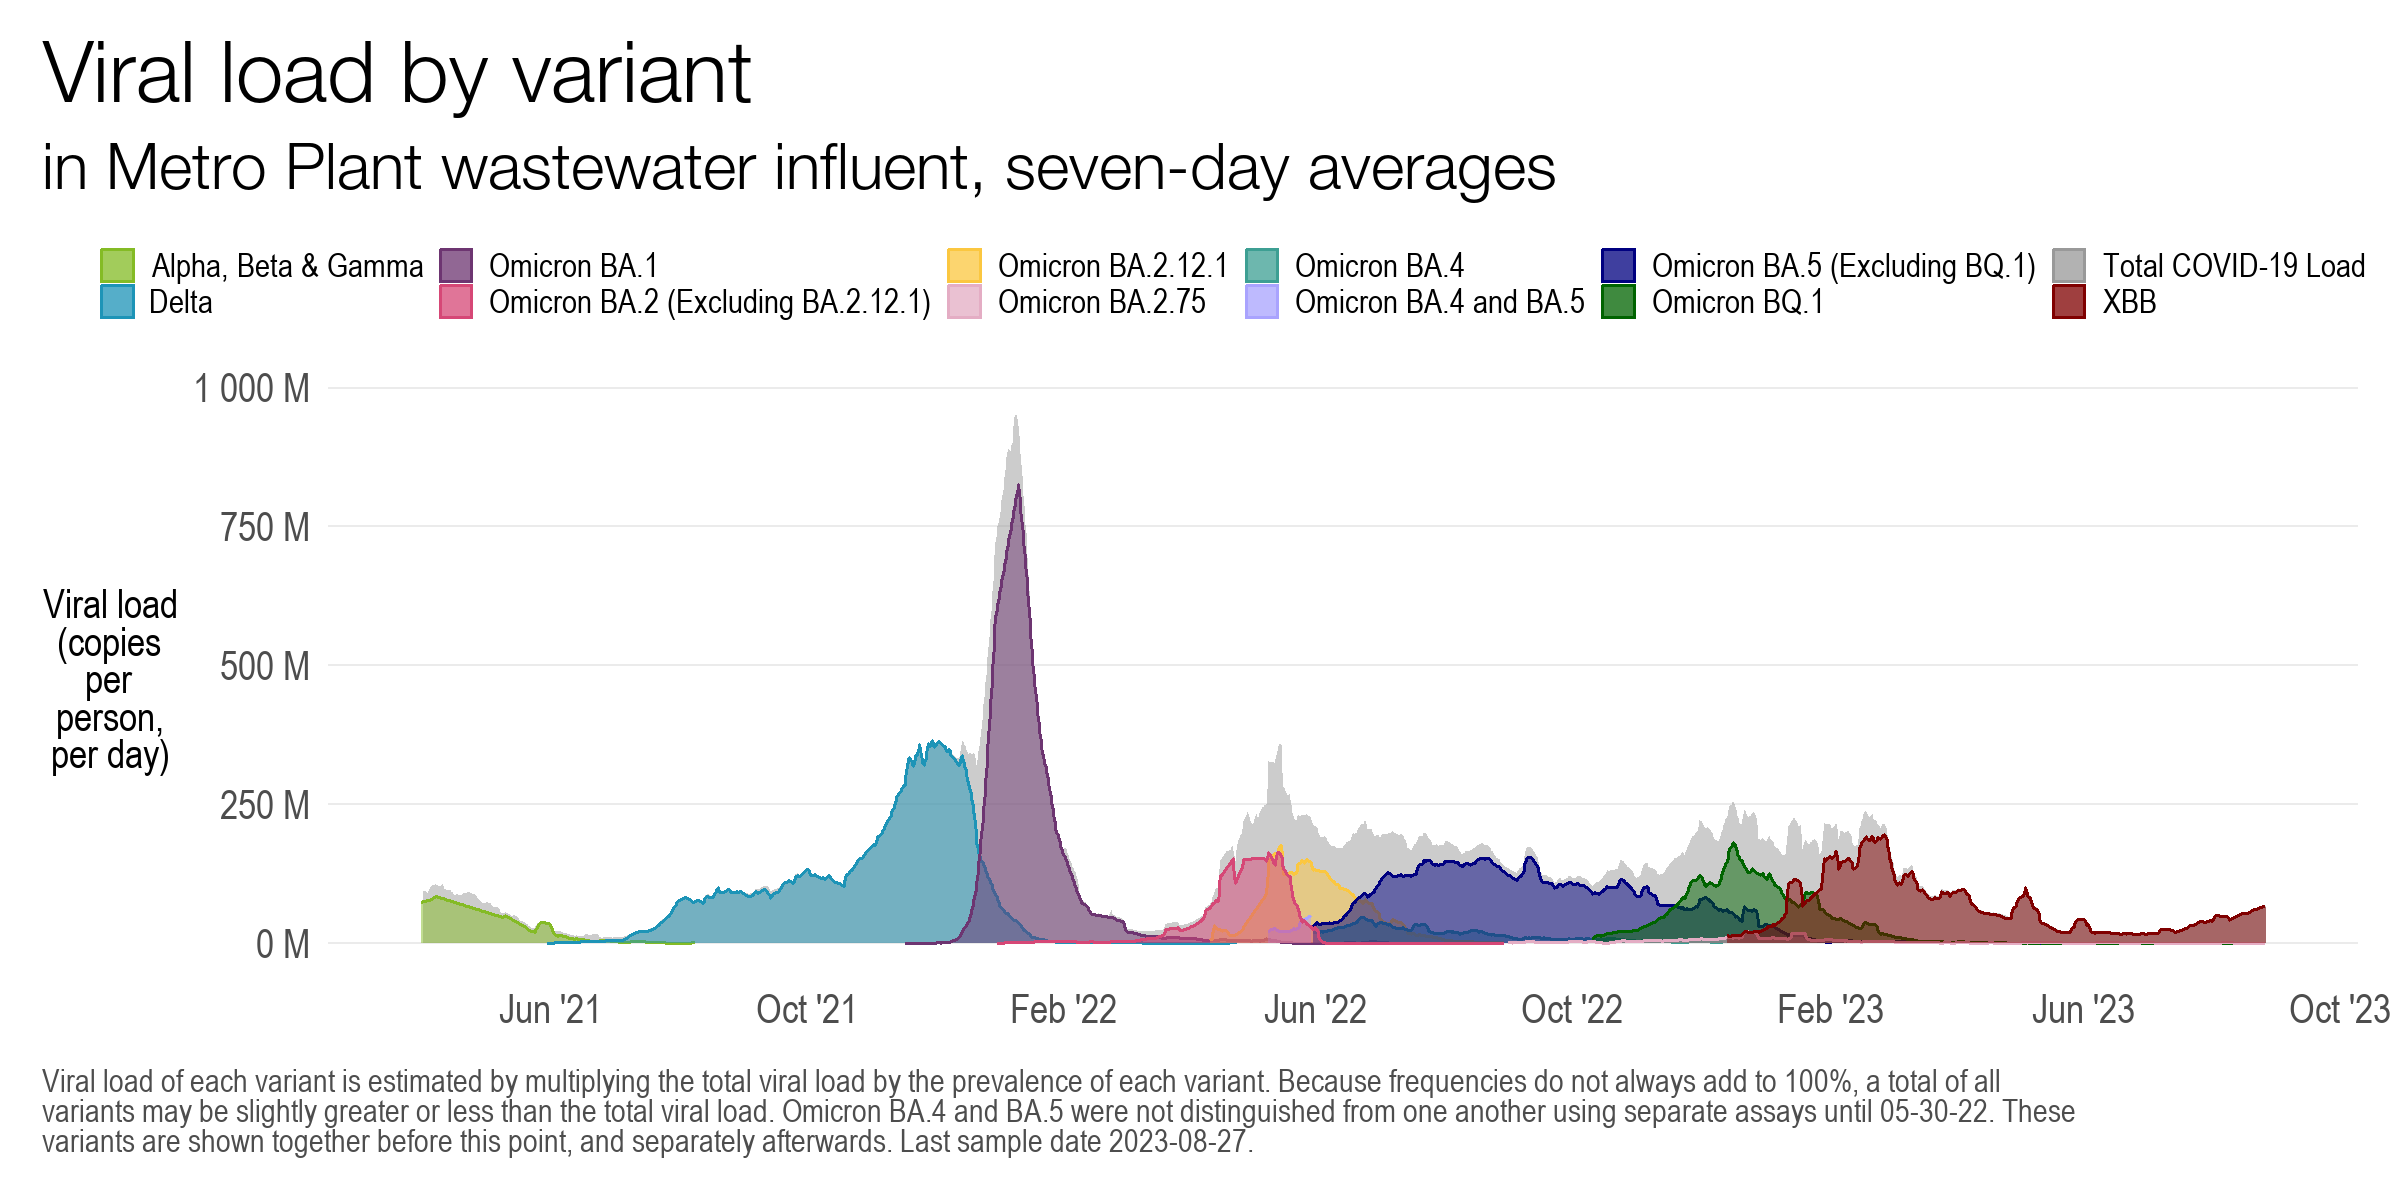
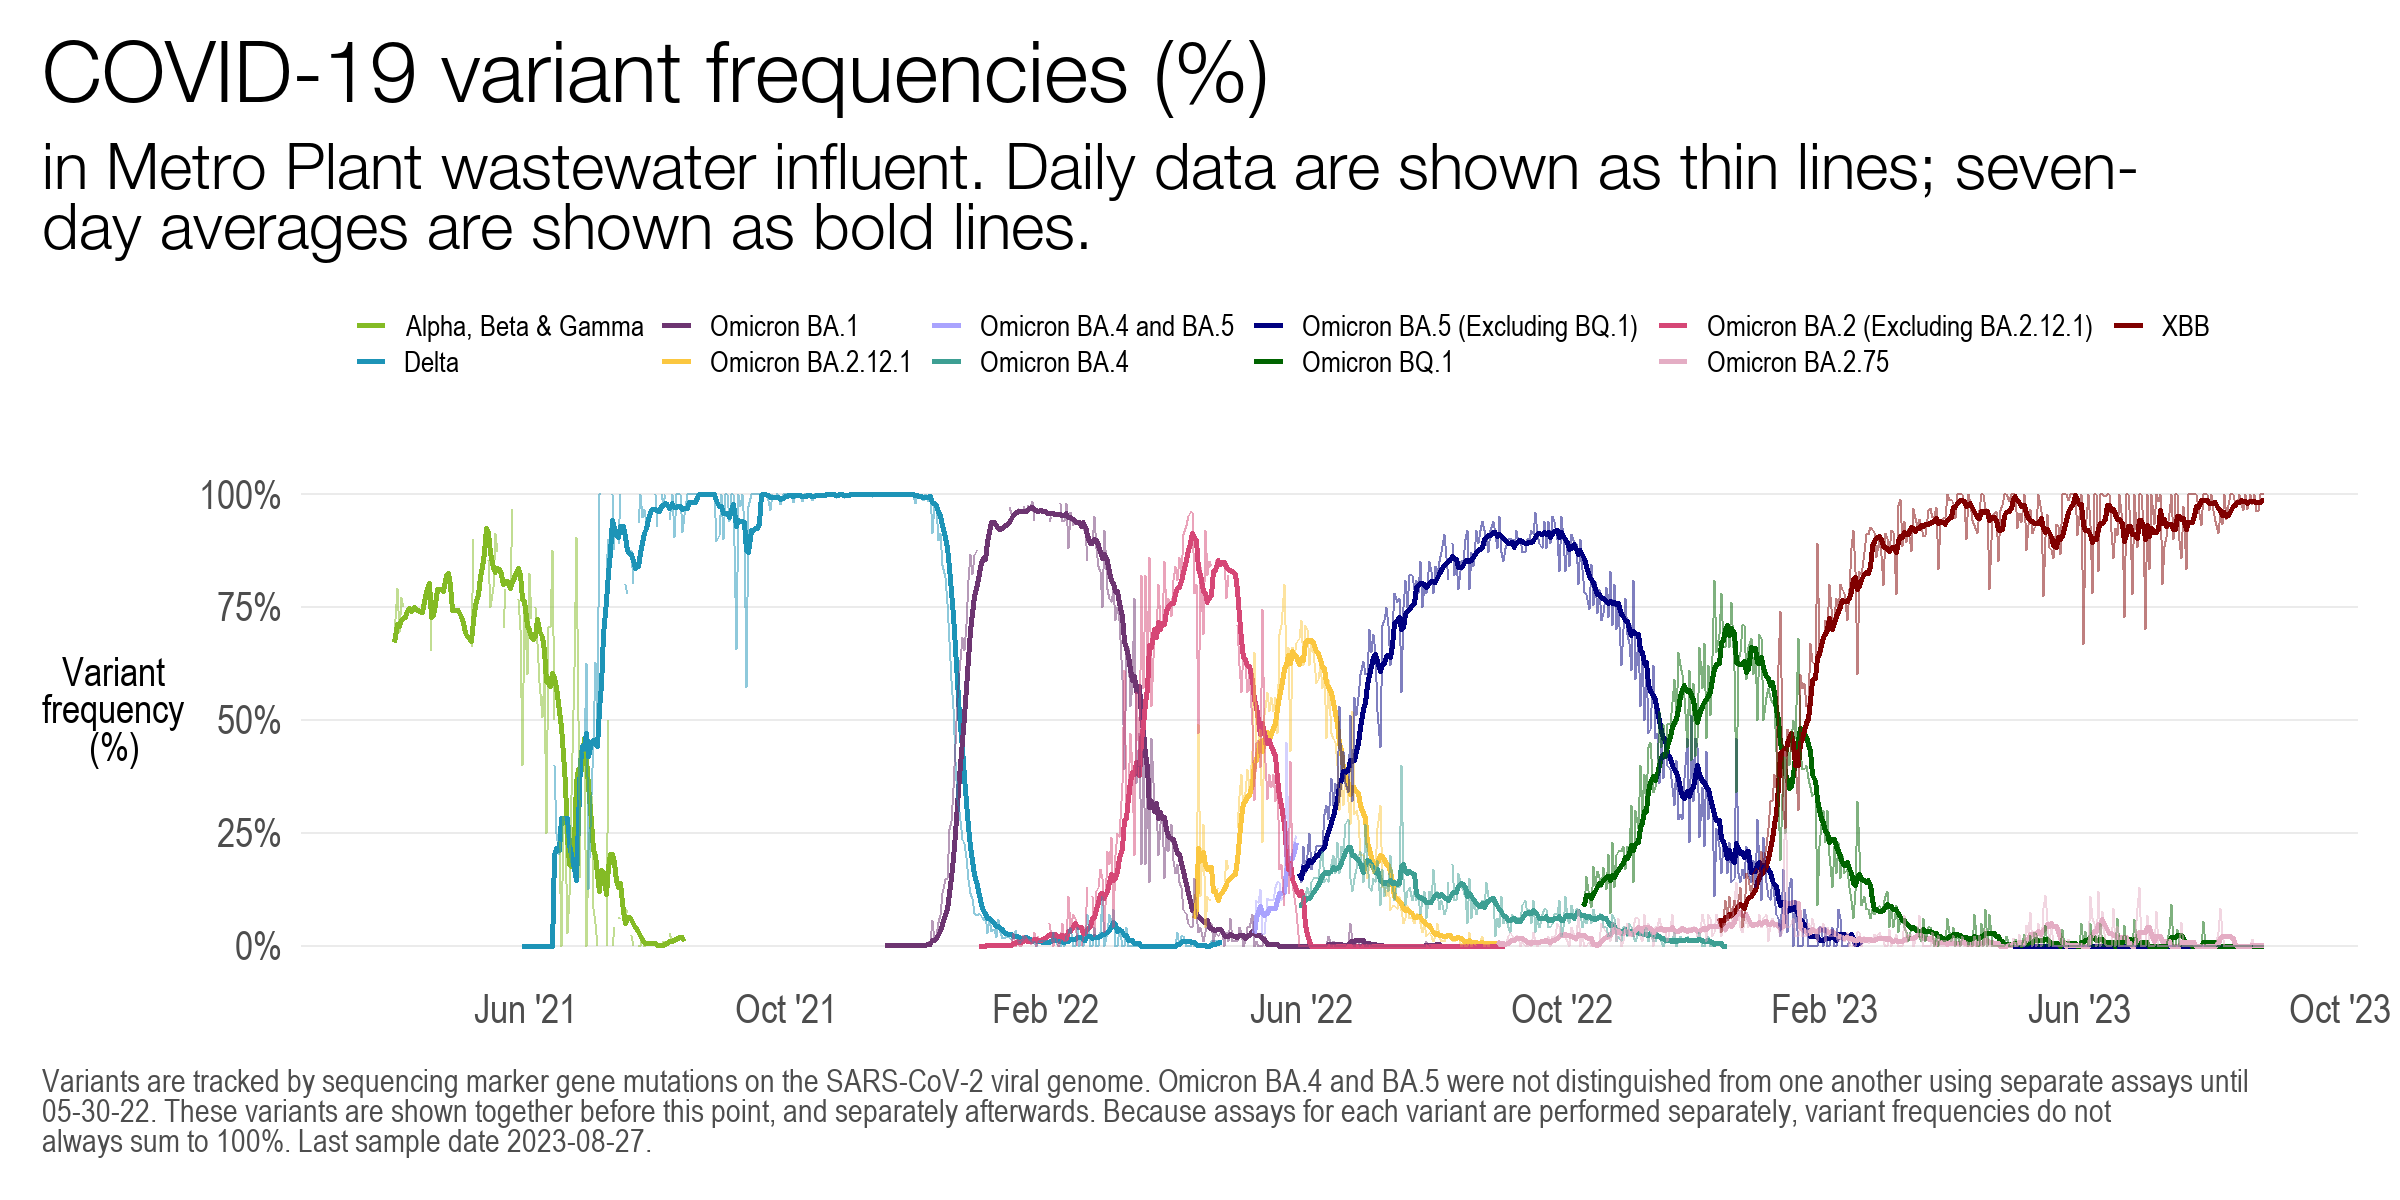
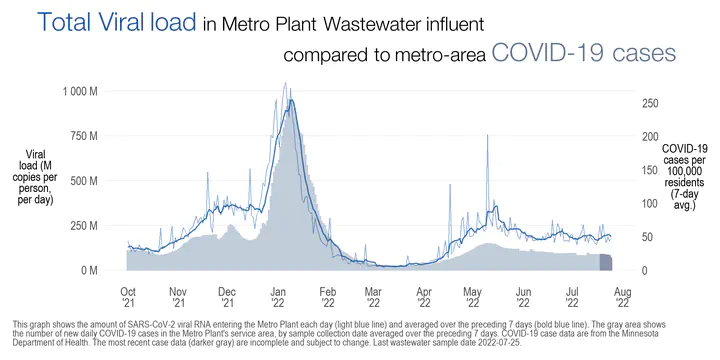
In early 2022, my team was approached by scientists in the Council’s Environmental Services (ES) division for assistance. Throughout the pandemic, ES and the University of Minnesota Genomics center tracked viral genetic material in metro wastewater. The data was relatively uniform, but existing reports were internal facing and written for a highly technical audience. The ES team wanted to make the data more readily available, easily understandable, and easy to explore.
In a matter of days, my team assembled a prototype R Shiny app and began collaborating on GitHub. We made the repository public, and I used my expertise in R Shiny to develop an interactive data visualization tool. I completed onboarding git training with a new colleague and set up GitHub best practices and workflows, like using feature based branches, completing pull requests with code reviews, and using sustainable data storage. I managed community submitted GitHub Issues and facilitated code contributions.
In addition, I created a GitHub Actions workflow that automatically checks for package dependencies and securely deploys the app to our shinyapps.io account. I configured the app on shinyapps.io to handle flash traffic and scale easily.
Awards
In March 2022, my teammates and I were awarded the “Keystone Award”.
A cross-functional team came together to effectively share our monitoring data on the Met Council’s COVID-19 wastewater surveillance webpage and with the media. They conducted the science; compiled, visualized, and shared the data; and communicated about the work externally.
The Keystone Award recognizes employees who demonstrate exceptional work performance. This award recognizes employees for being good ambassadors for the agency and for delivering unique, exceptional and inspired projects that reflect well on the agency.
Media coverage and community response
As of June 2022, the COVID wastewater monitoring project page on metrocouncil.org is the highest viewed page in the organization’s history.
“How wastewater works to detect COVID, other viruses in Minnesota” by Jeremy Olson, Star Tribune link
“Poop surfaces as crucial tool to track Twin Cities COVID” by David H. Montgomery, Minnesota Public Radio News link
“In Sewage, Clues to Omicron’s Surge” by Emily Anthas and Sabrina Ambler, The New York Times link
I think this is just fascinating, but after diving in, I'm most interested in the fact that the @MetCouncilNews named their GitHub repository "covid poops" https://t.co/17KoXgbfir
— Nick (@NKroegs) January 19, 2022
Recent data
See the public repo for the most recent data.