Color palette exploration
Color palette exploration with ggplot2 and generative methods
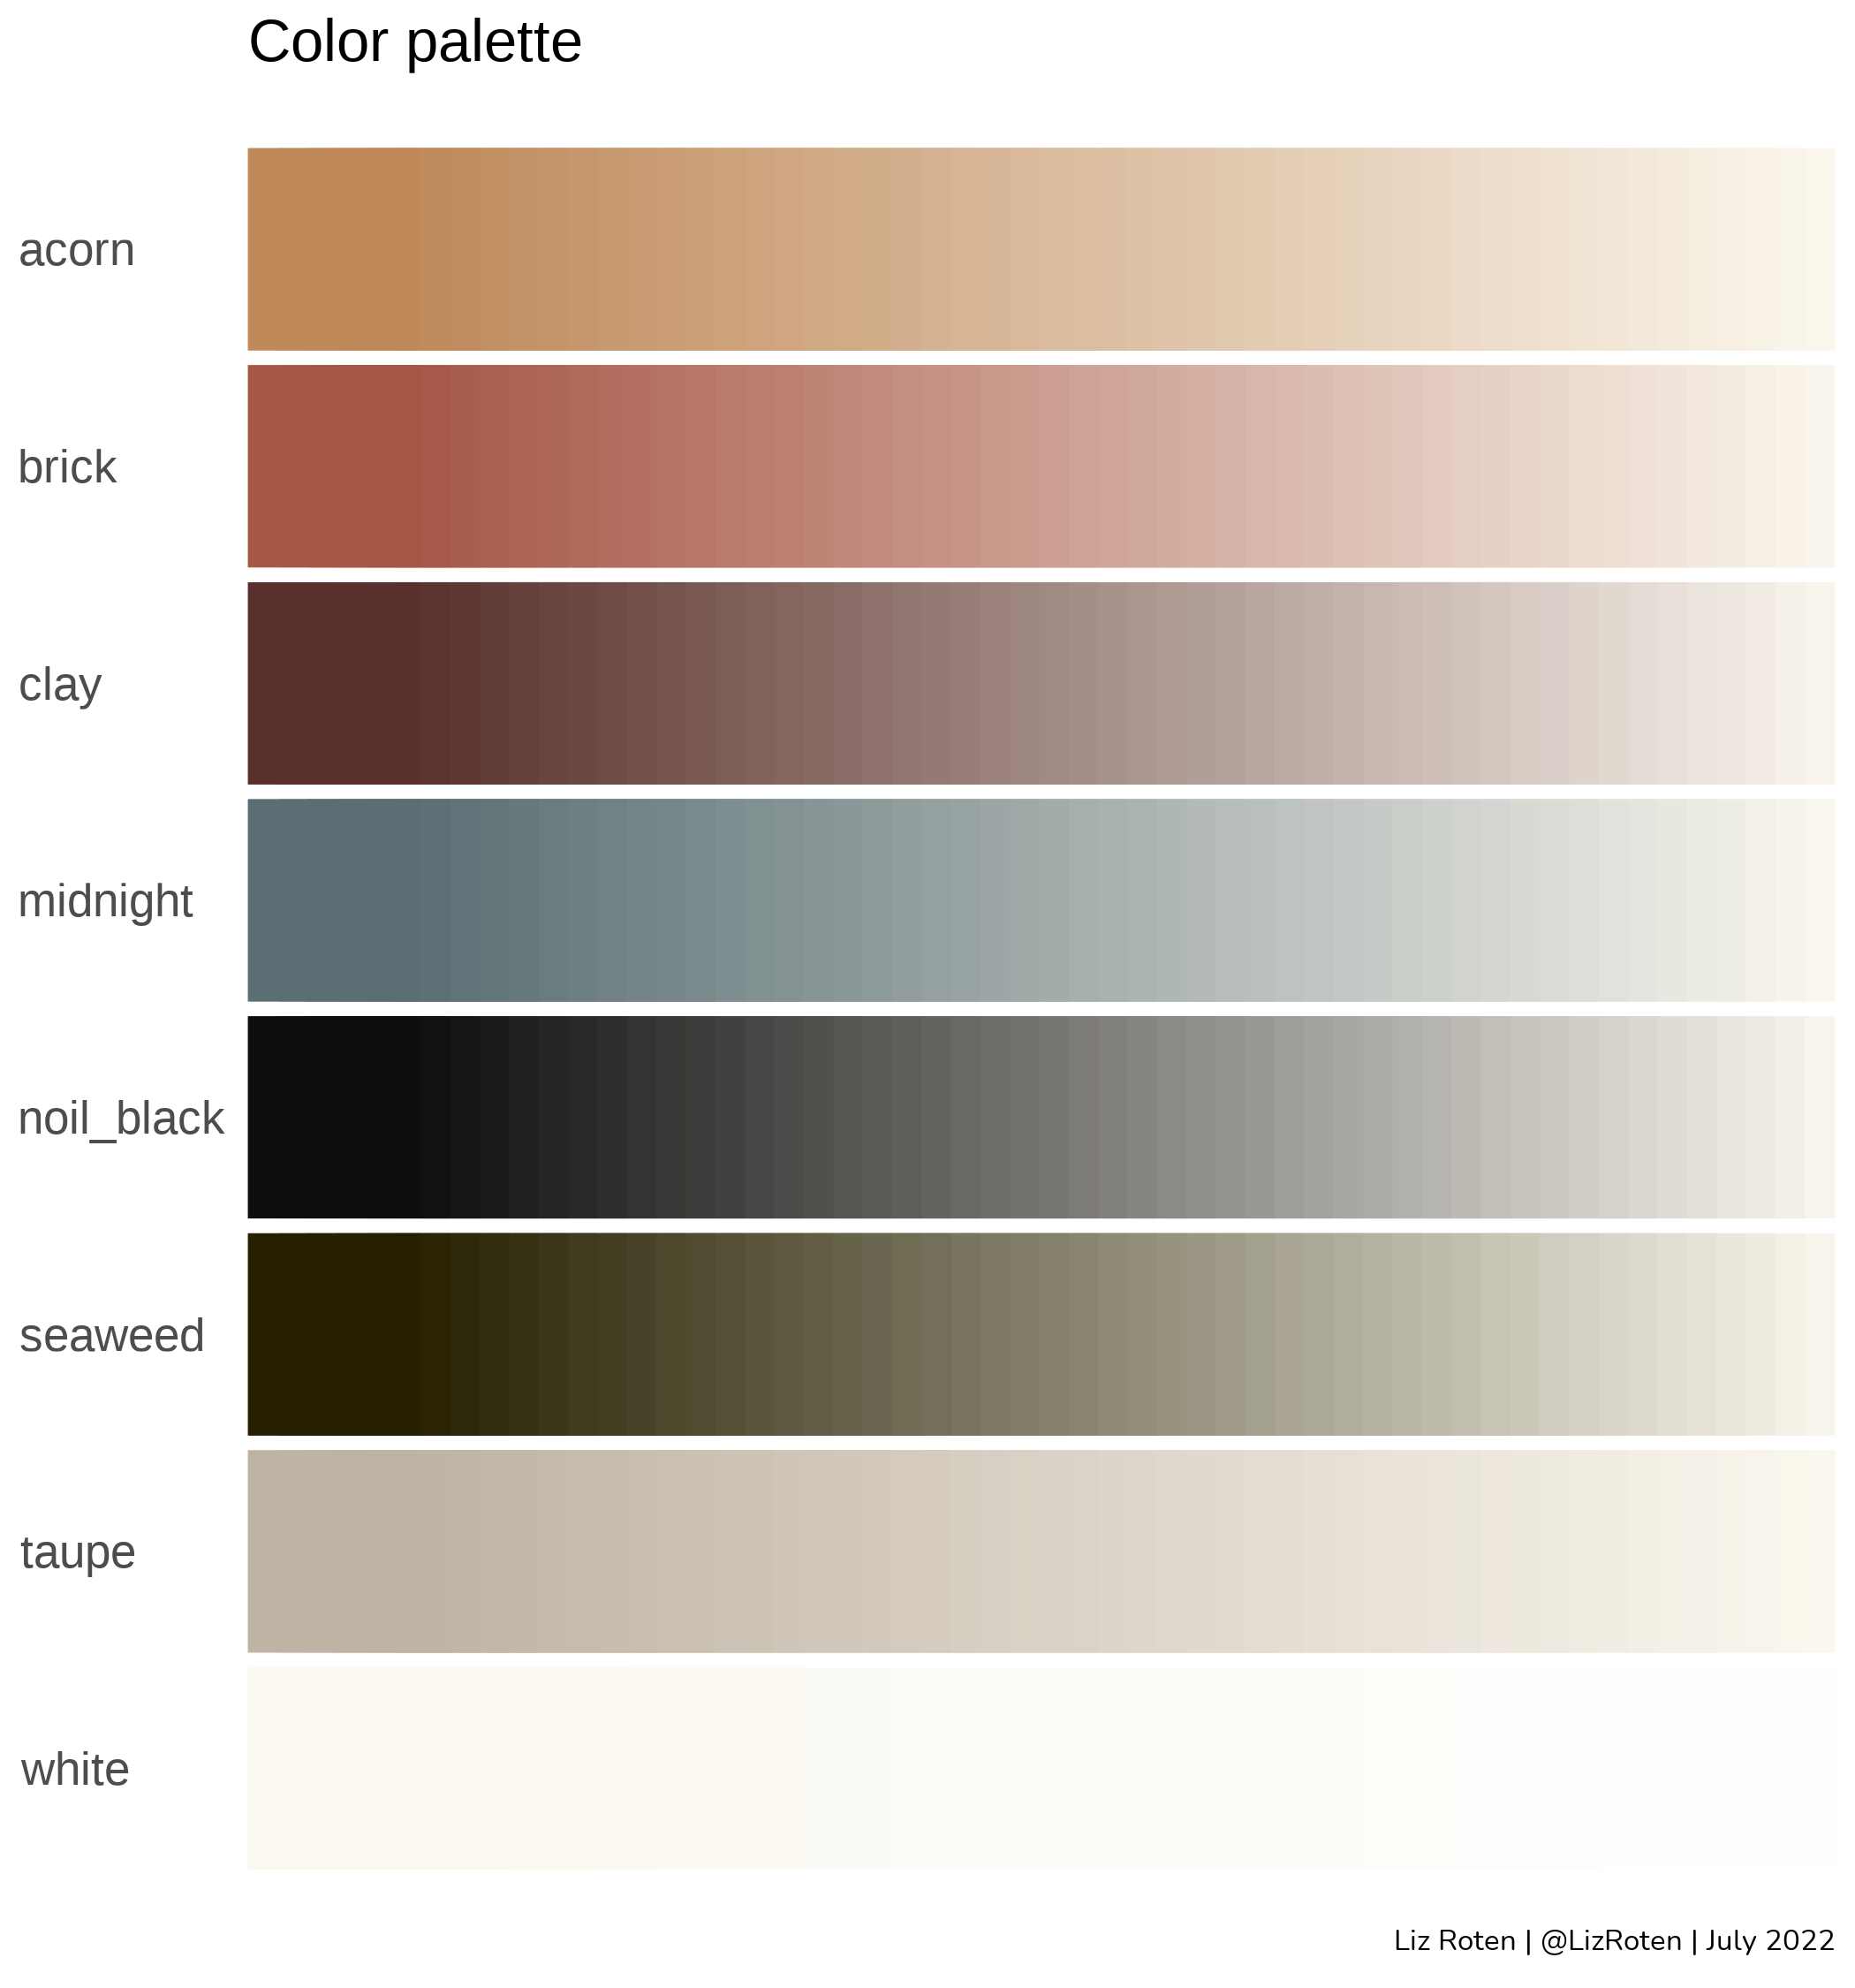
Color palette
I’m having a moment with linen, so I decided to make my color palette for my rstudio conference talk match some of my favorite hues.
Colors based on {dutchmasters}, semi.joan’s instagram, and Blackbird Fabrics collection of linen.
dutch_white <- dutchmasters$pearl_earring["white(colar)"]

brick <- colorRampPalette(c("#A65746", dutch_white))

midnight <- colorRampPalette(c("#5A6E73", dutch_white))

clay <- colorRampPalette(c("#59302D", dutch_white))

taupe <- colorRampPalette(c("#BFB3A4", dutch_white))

acorn <- colorRampPalette(c("#BF895A", dutch_white))

seaweed <- colorRampPalette(c("#262001", dutch_white))

noil_black <- colorRampPalette(c("#0D0D0D", dutch_white))

white <- colorRampPalette(c(dutch_white, "#FFFFFF"))
Function to create palette ramp with a set number of levels.
create_palette_ramp <- function(x = 50) {
  tibble::tibble(
    family = c(
      rep("brick", x),
      rep("midnight", x),
      rep("clay", x),
      rep("taupe", x),
      rep("acorn", x),
      rep("noil_black", x),
      rep("white", x),
      rep("seaweed", x)
    ),
    level = c(rep(1:x, 8)),
    code = c(
      brick(x),
      midnight(x),
      clay(x),
      taupe(x),
      acorn(x),
      noil_black(x),
      white(x),
      seaweed(x)
    )
  ) %>%
    dplyr::arrange(-level)
}

palette_ramp50 <- create_palette_ramp()
ggplot(
  palette_ramp50,
  aes(
    x = level,
    y = family,
    color = code
  )
) +
  geom_point(
    size = 25.4,
    shape = 15
  ) +
  scale_color_identity() +
  scale_y_discrete(limits = rev) +
  labs(
    title = "Color palette",
    caption = my_caption
  ) +
  theme_minimal() +
  theme(
    axis.title = element_blank(),
    axis.text.x = element_blank(),
    axis.text.y = element_text(size = 40, hjust = 0),
    plot.title = element_text(size = 50),
    panel.grid = element_blank(),
    plot.caption = element_text(family = "Nunito",
                                size = 25)
  )
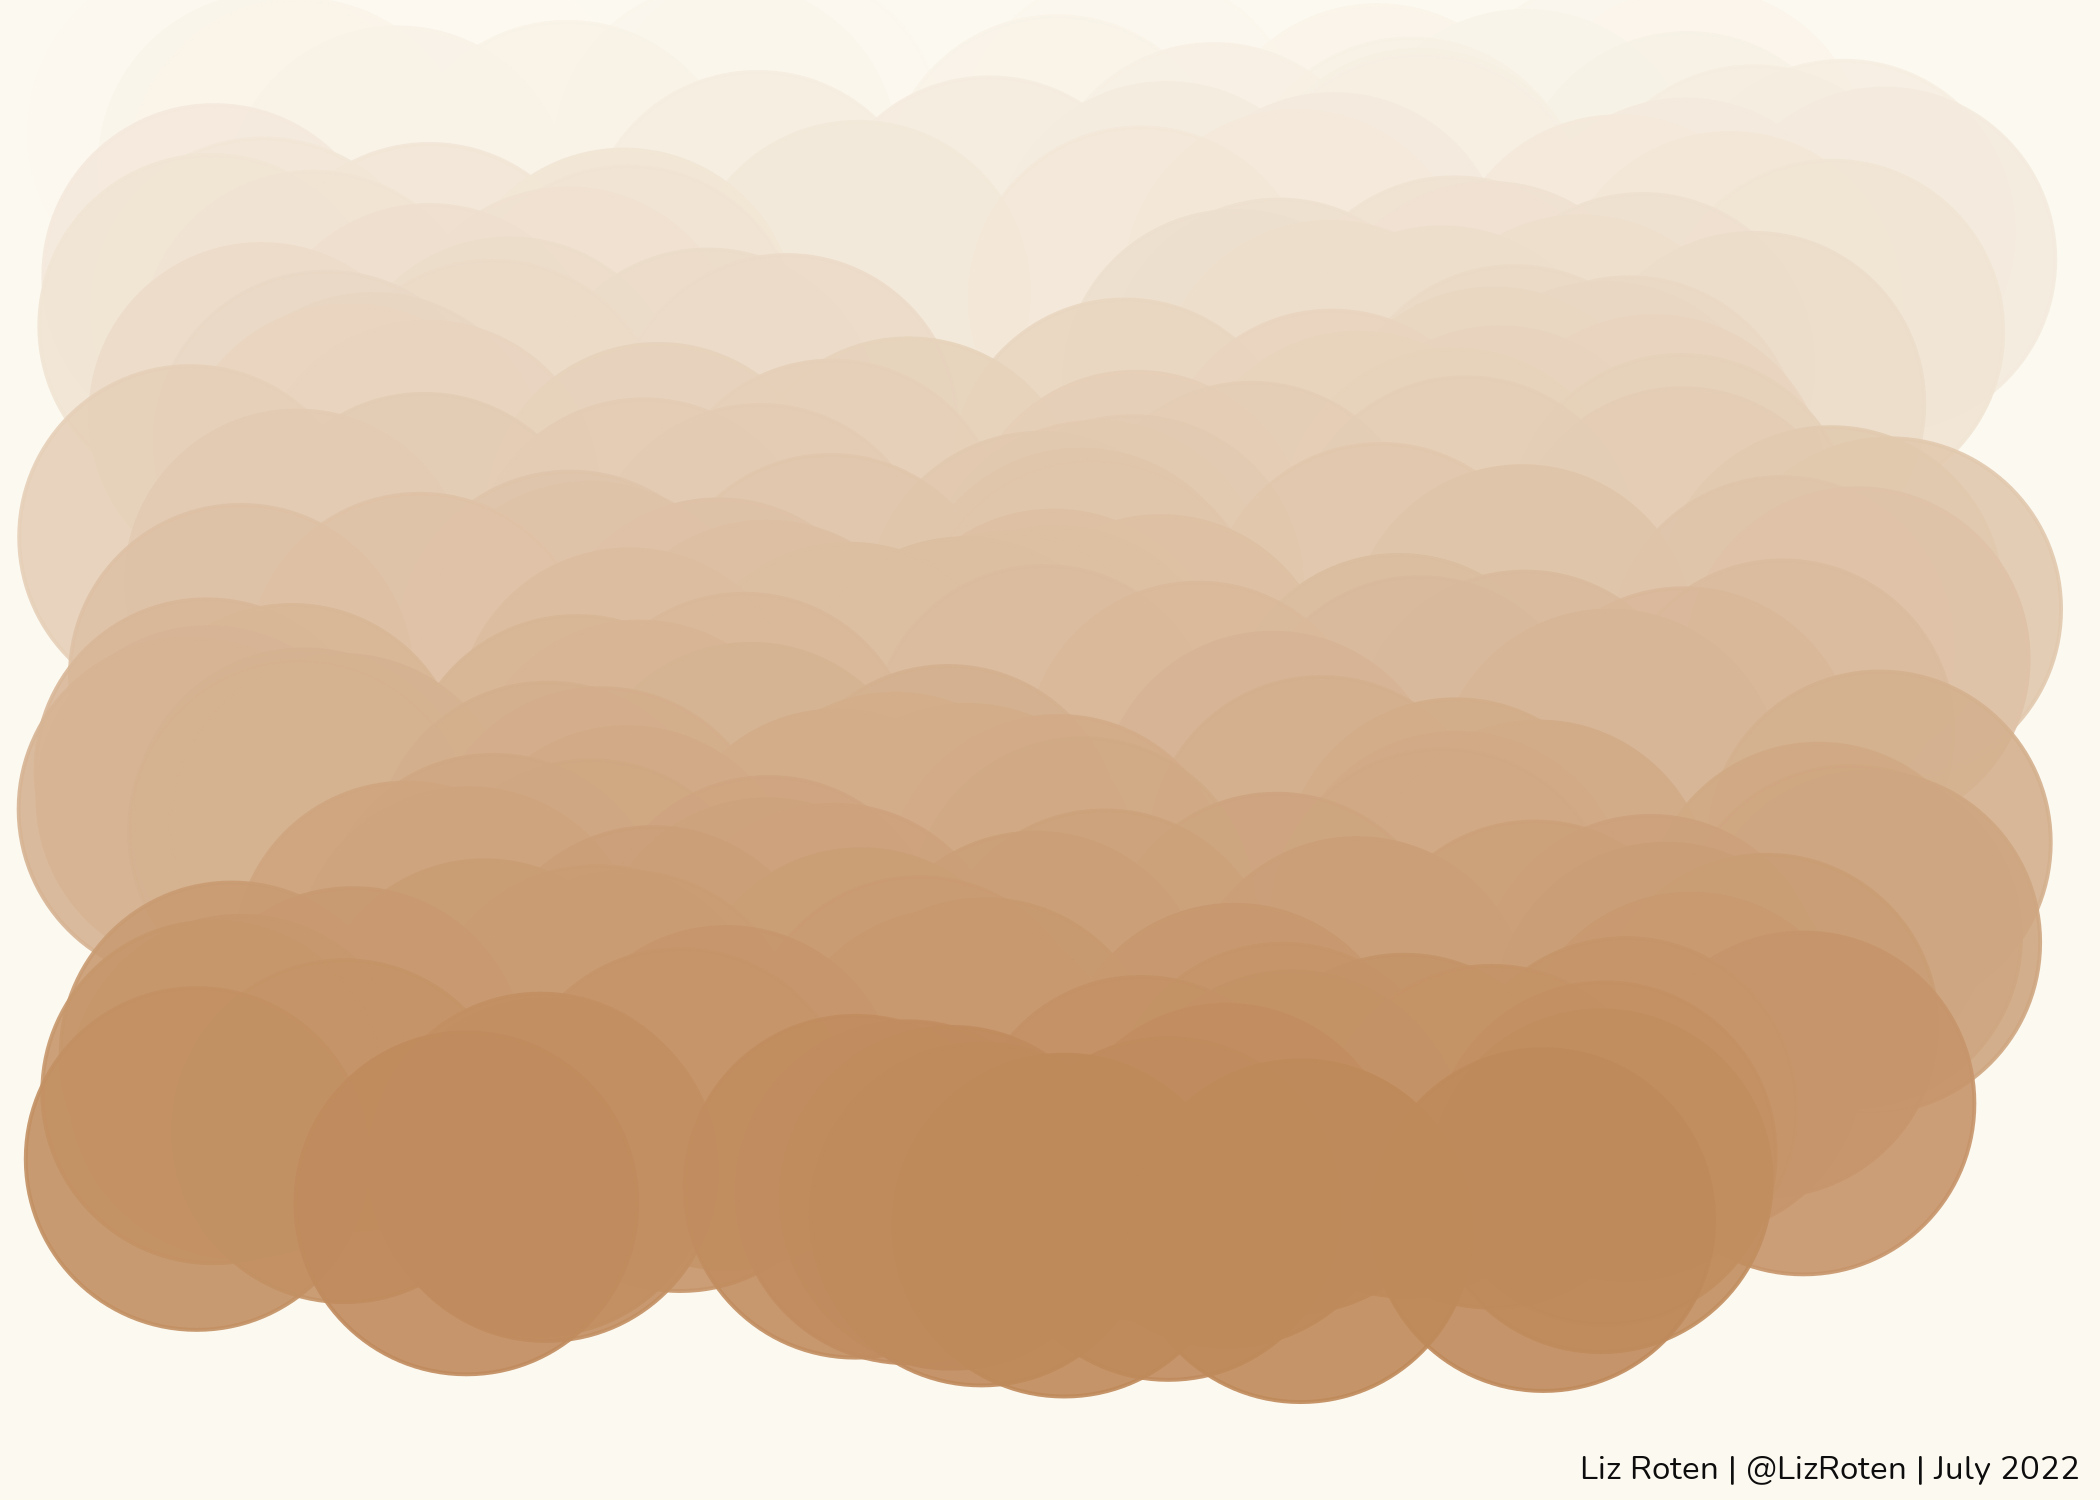
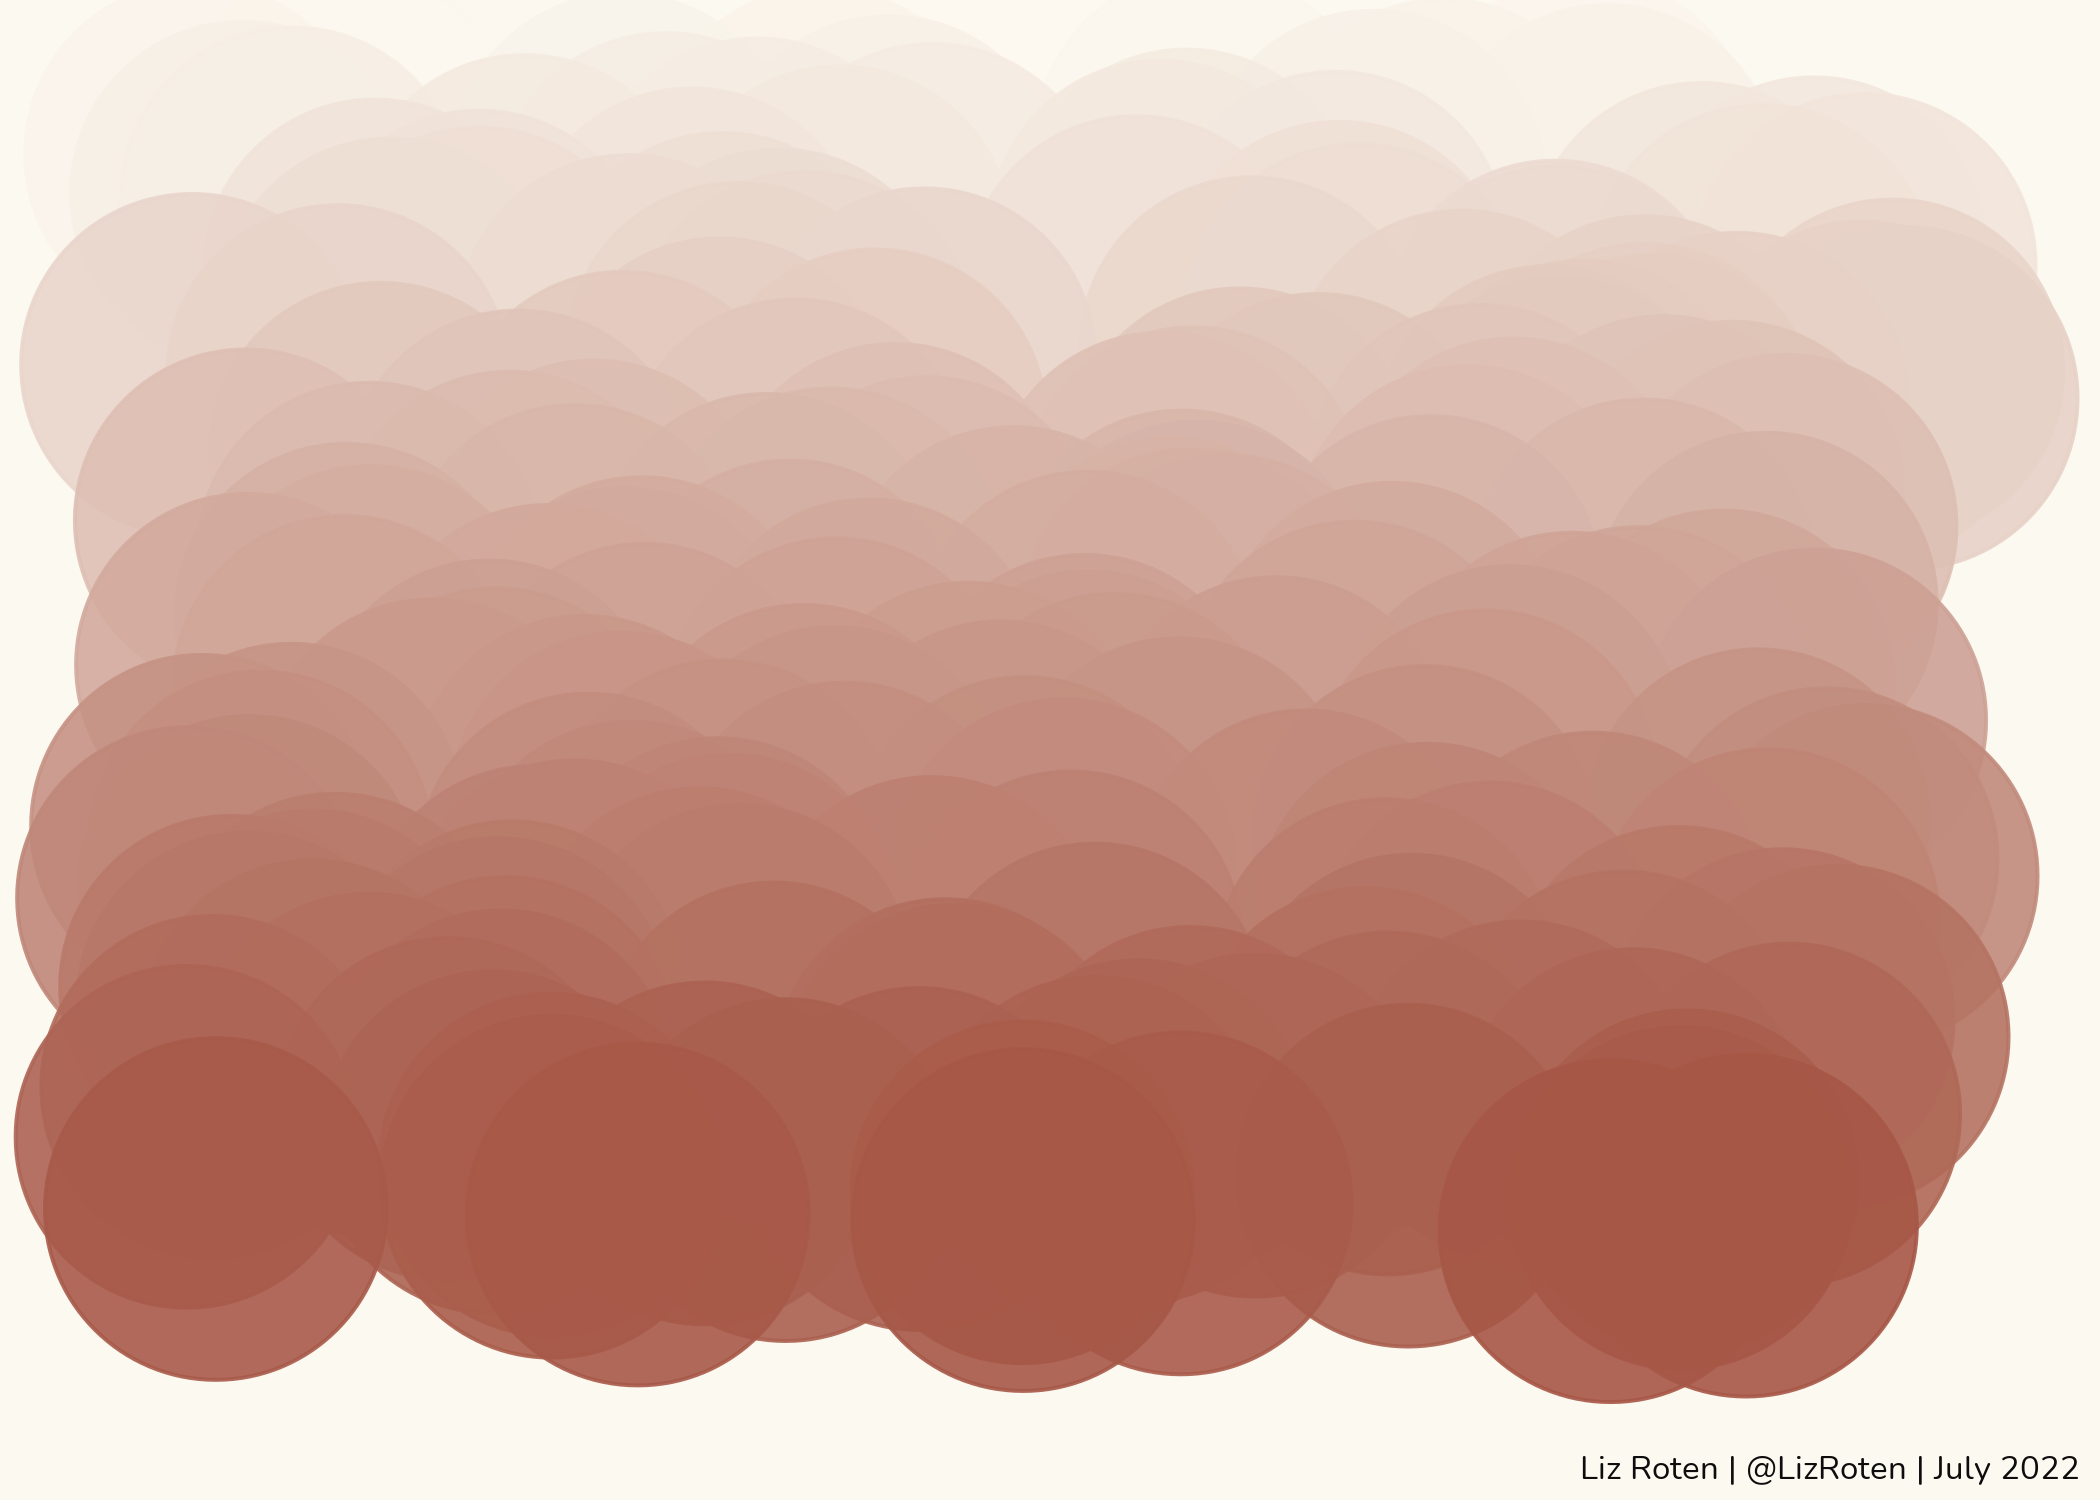
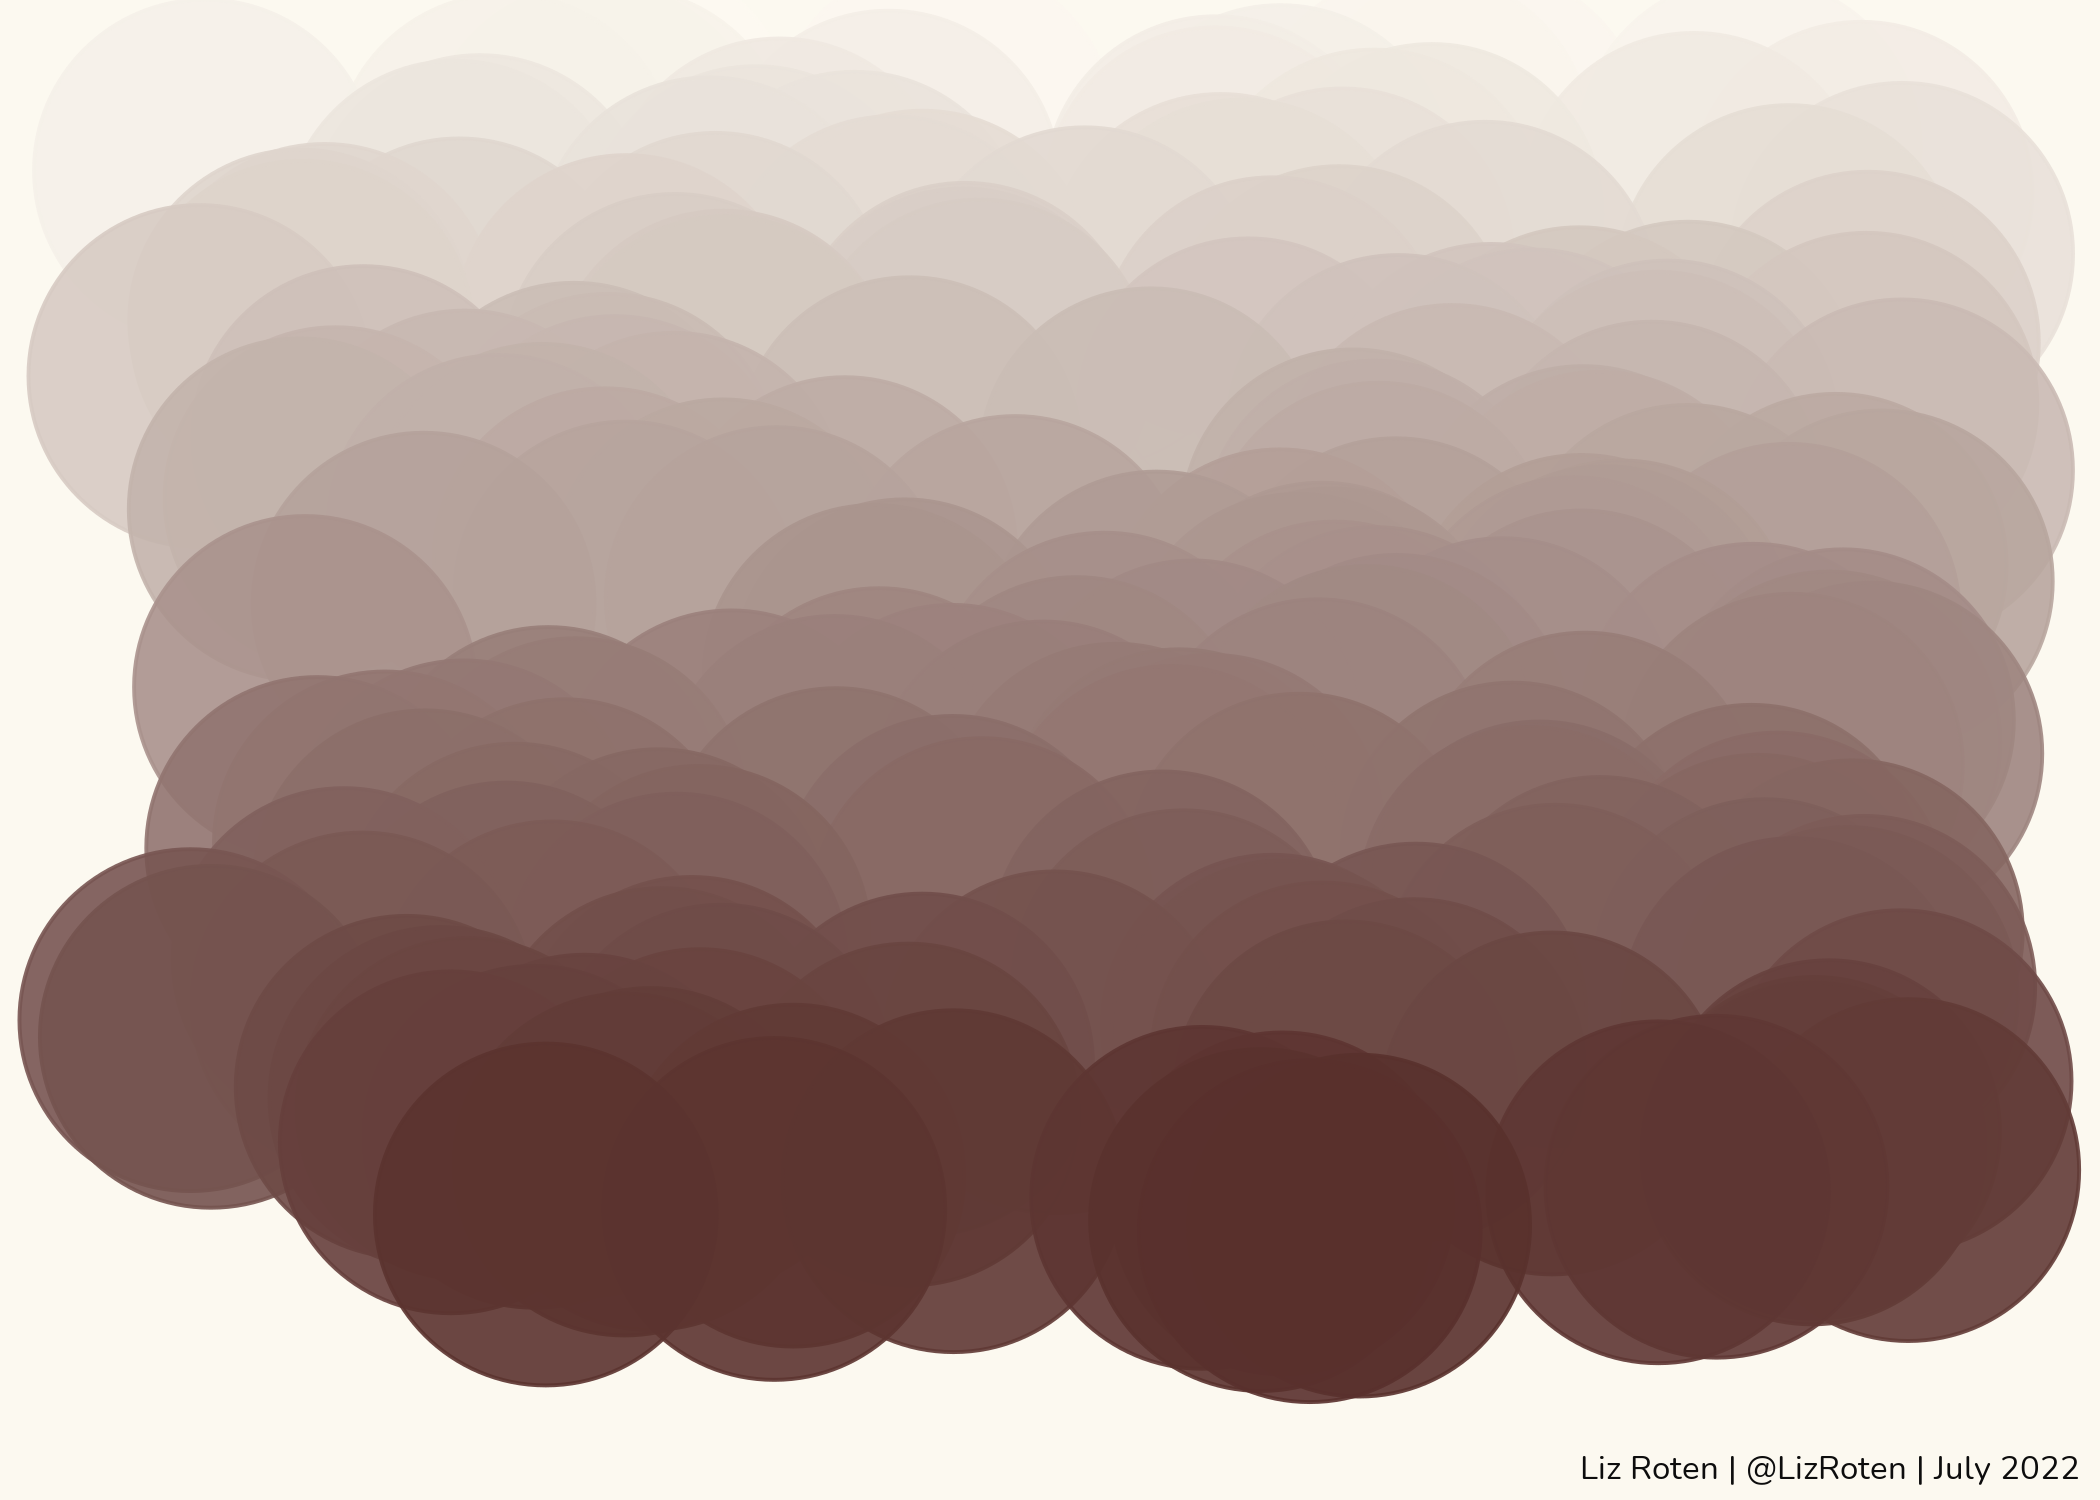
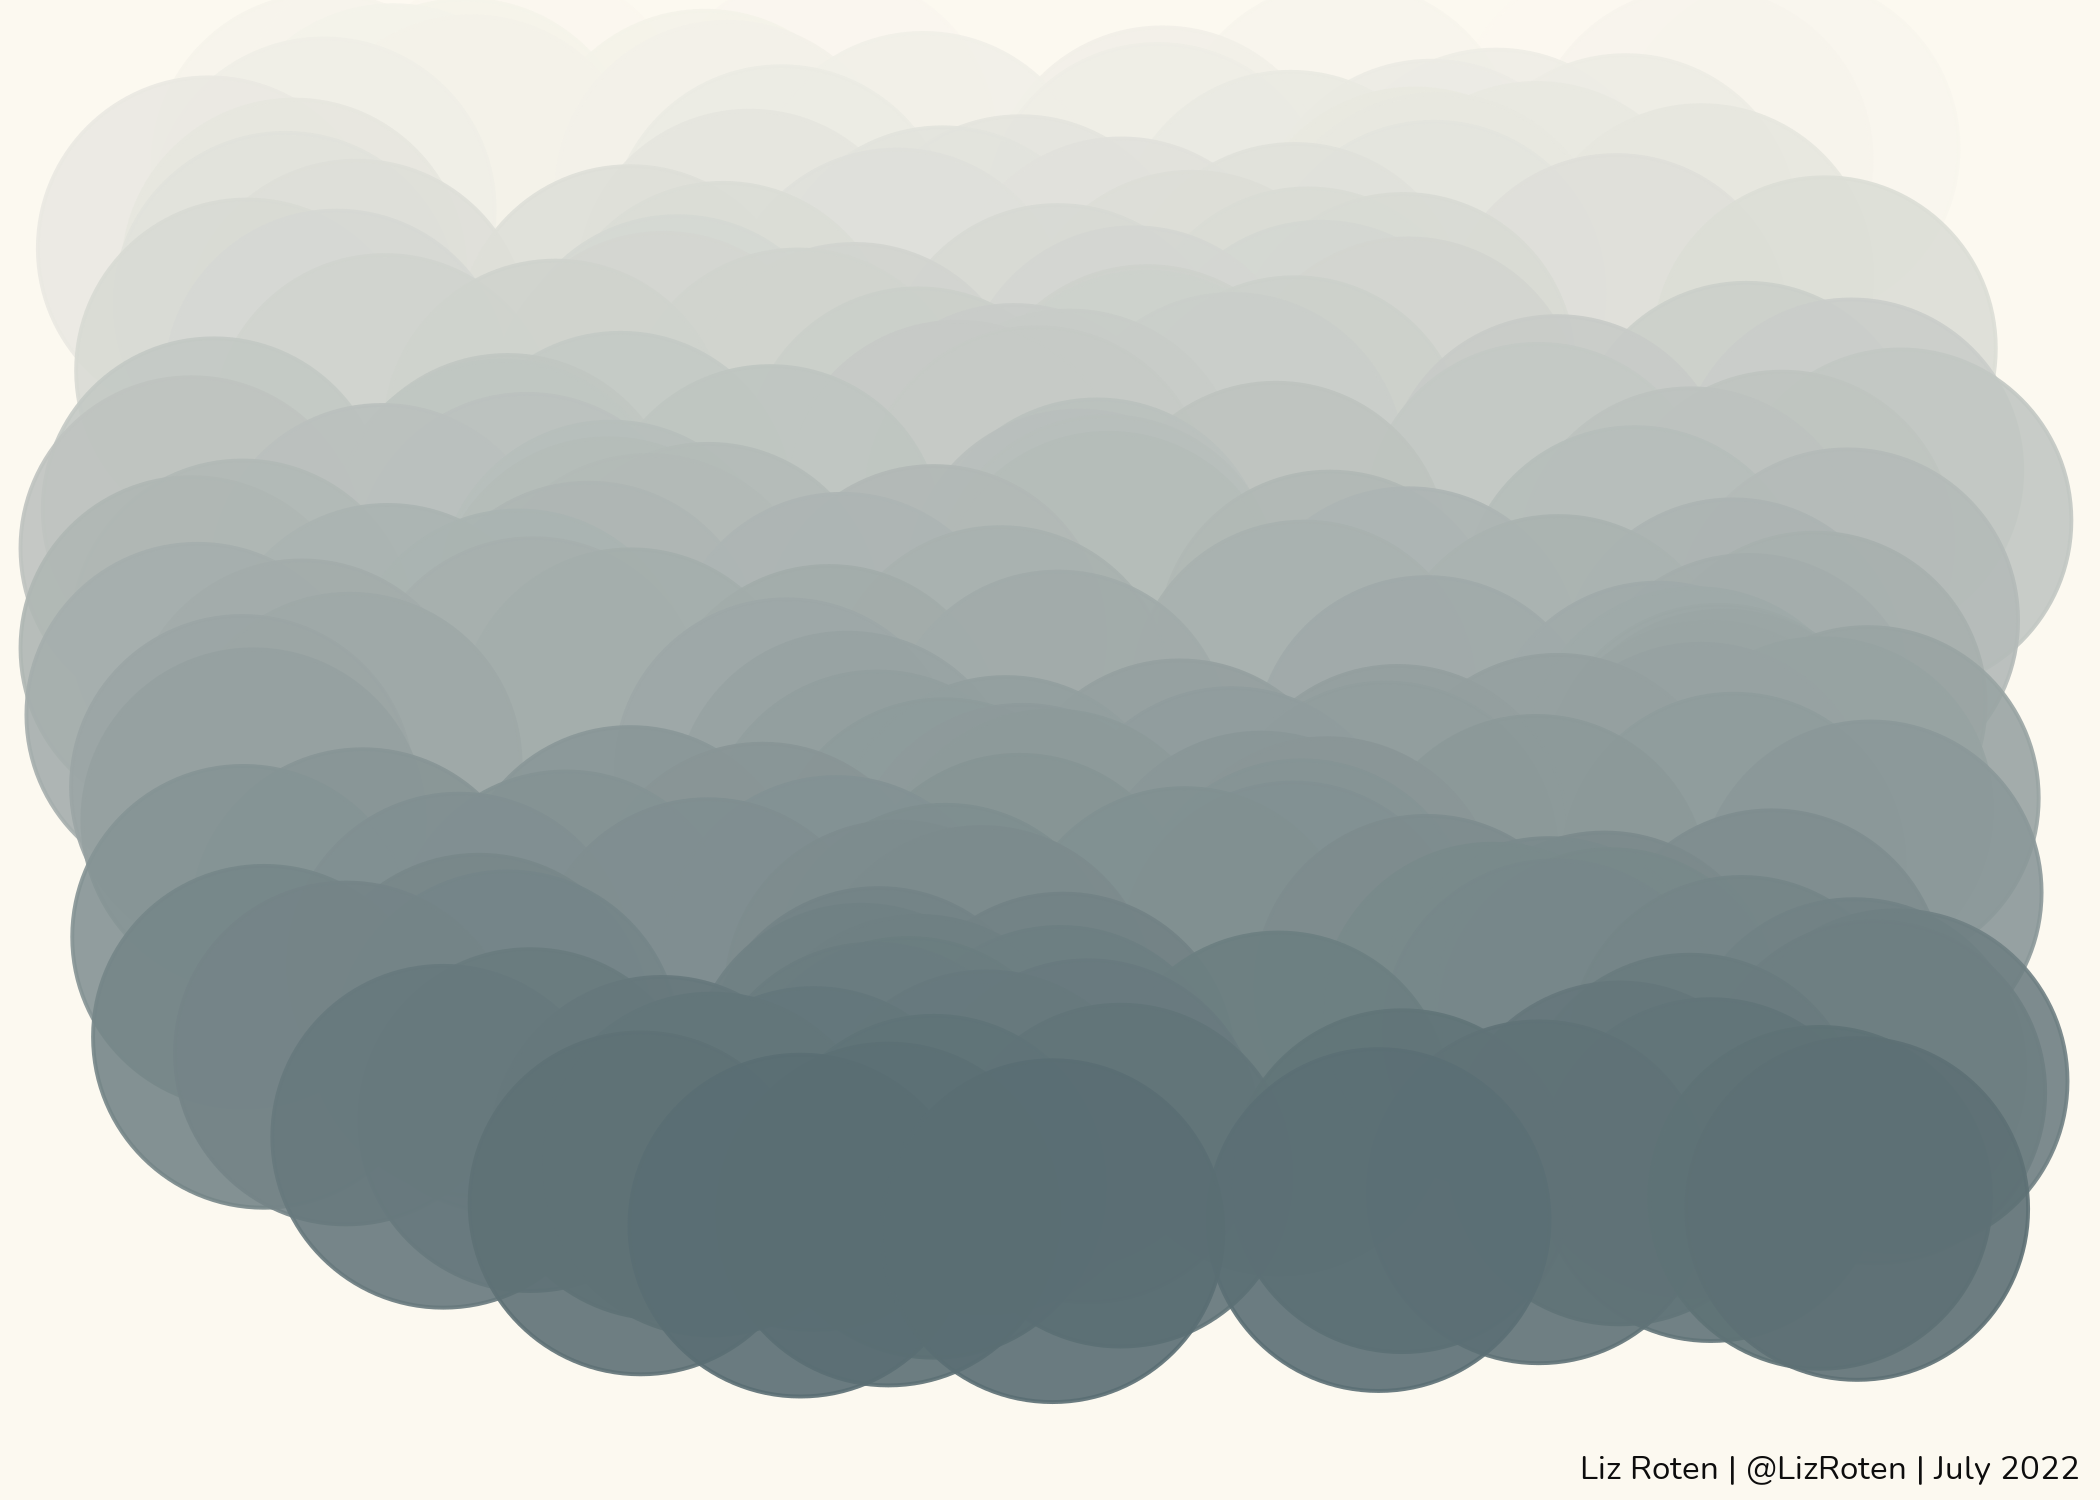
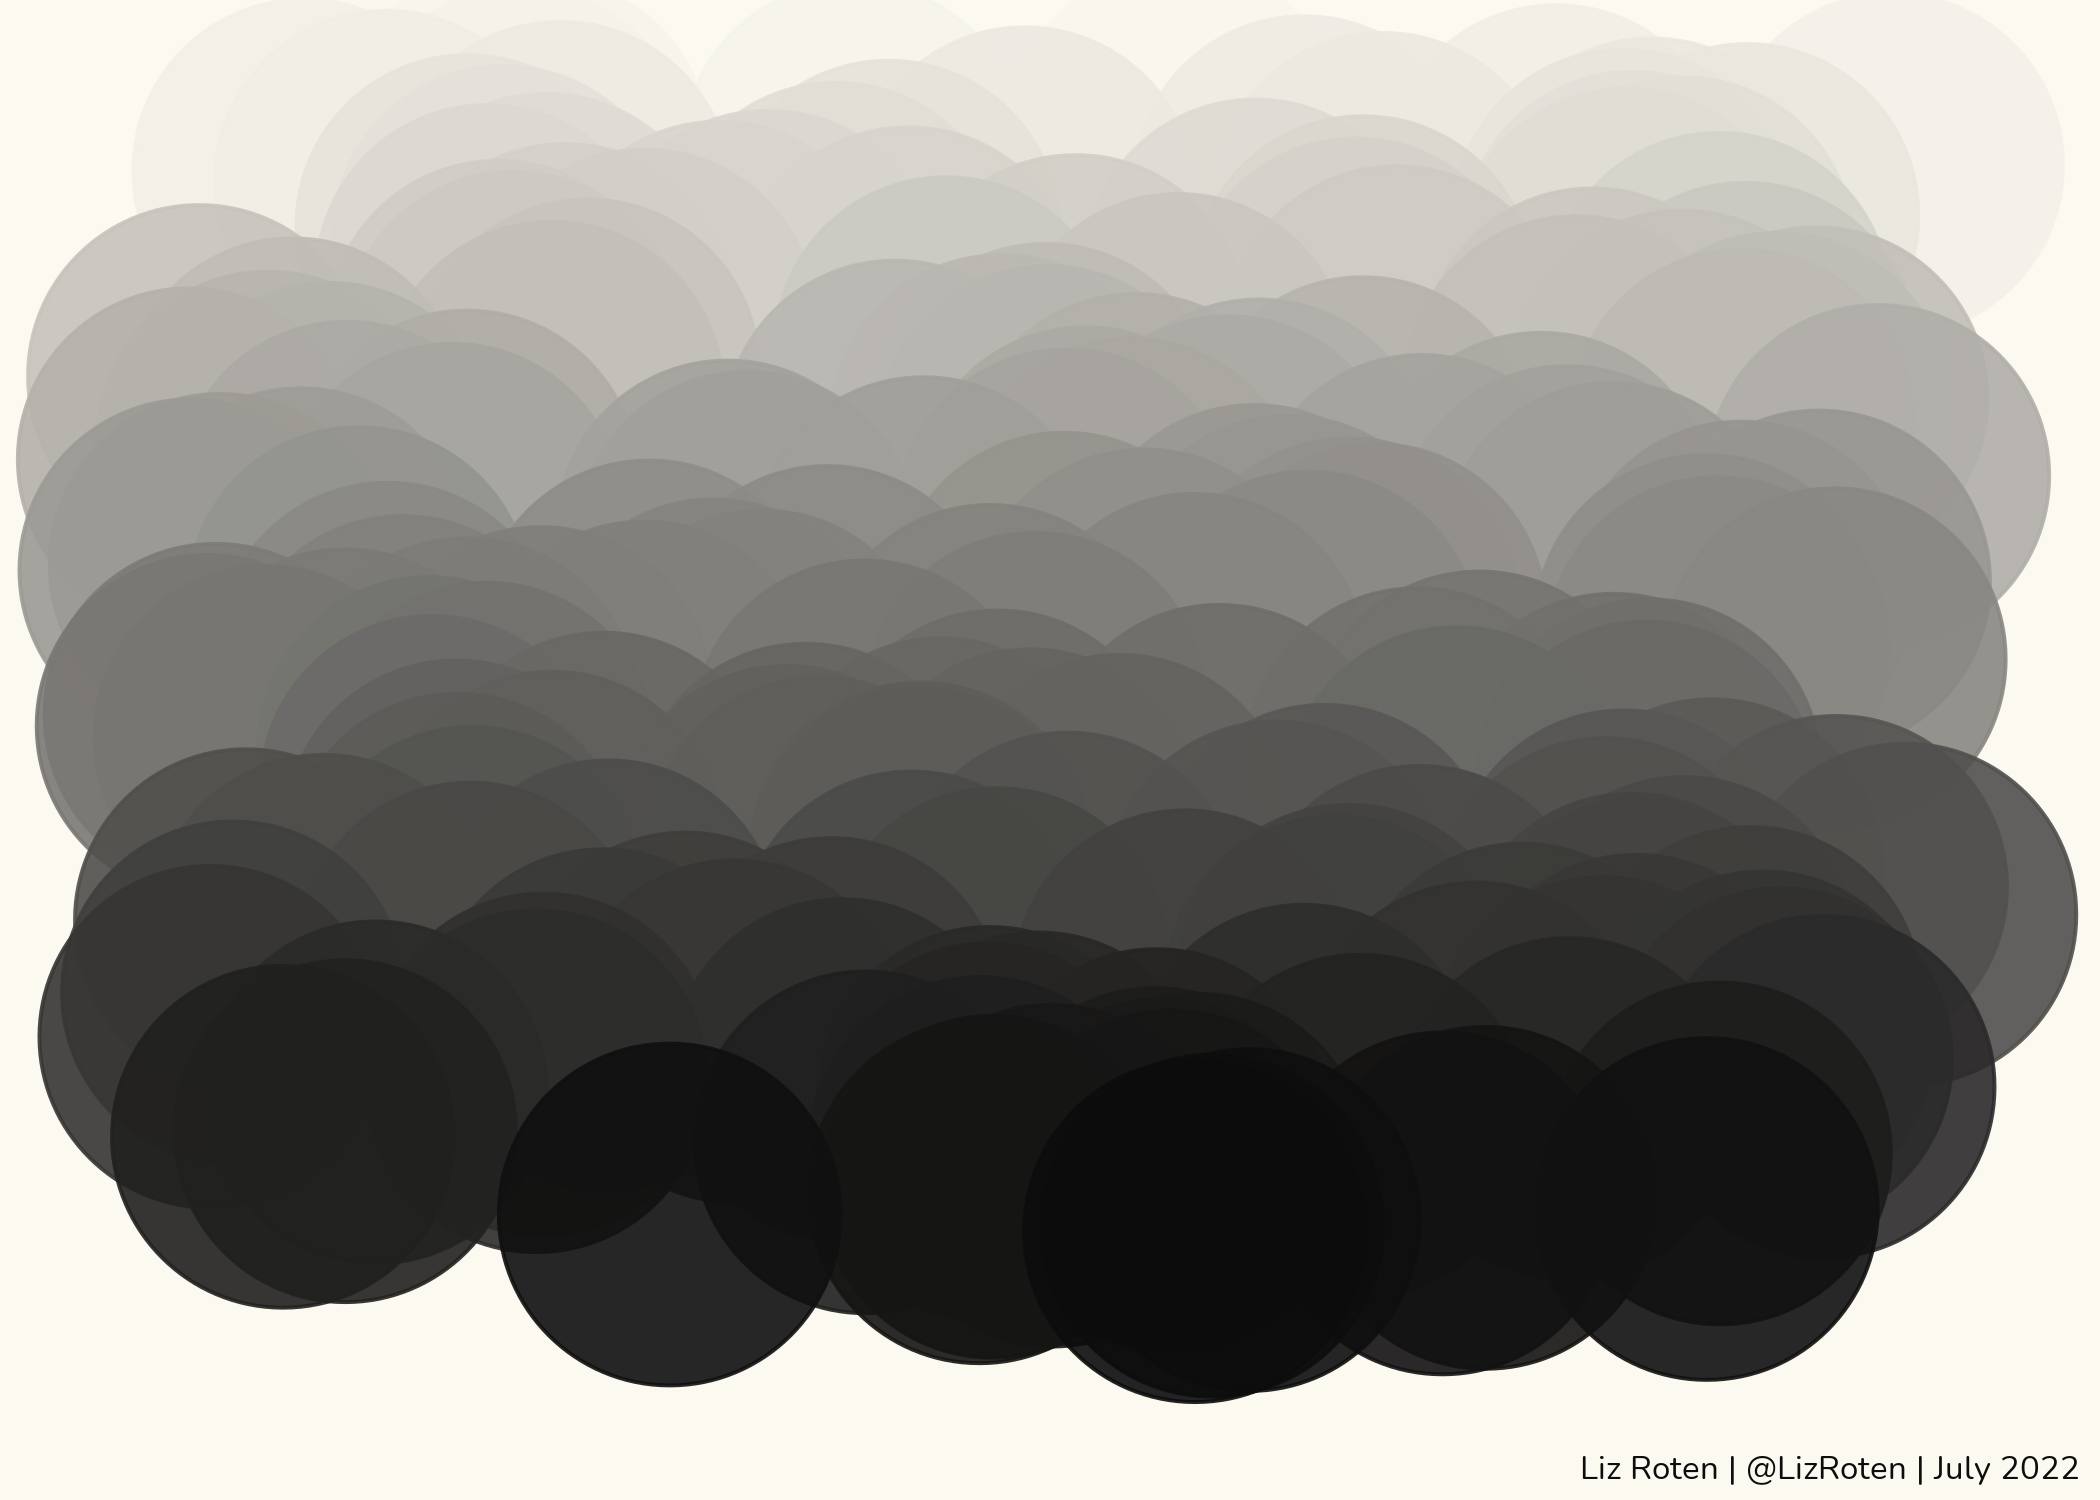
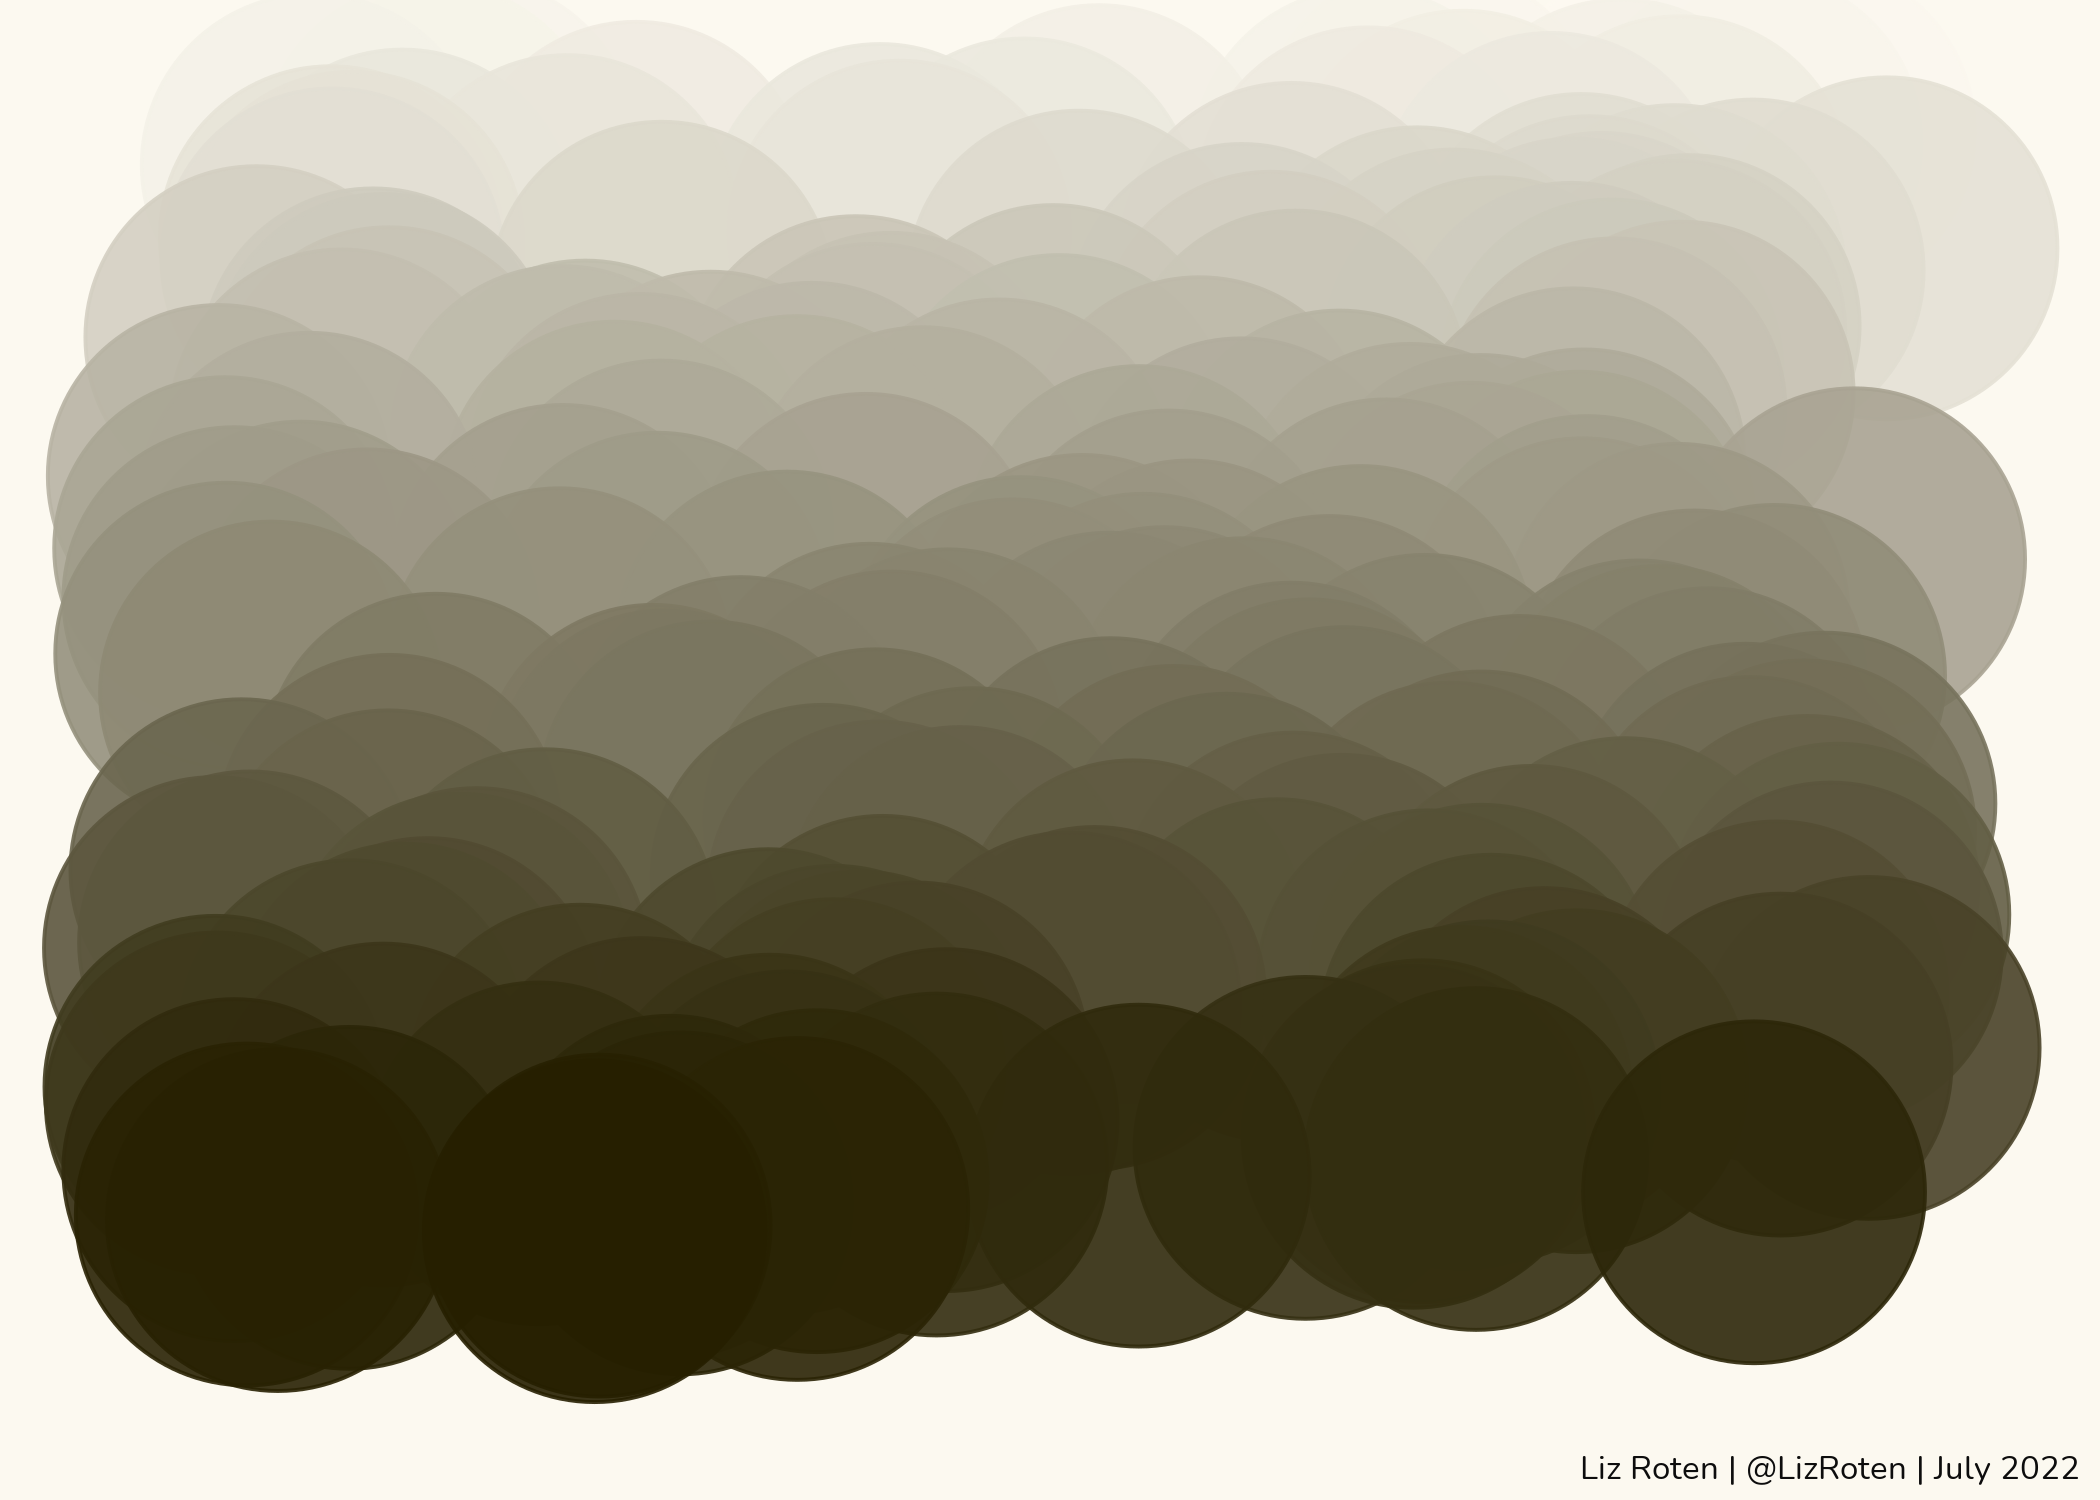
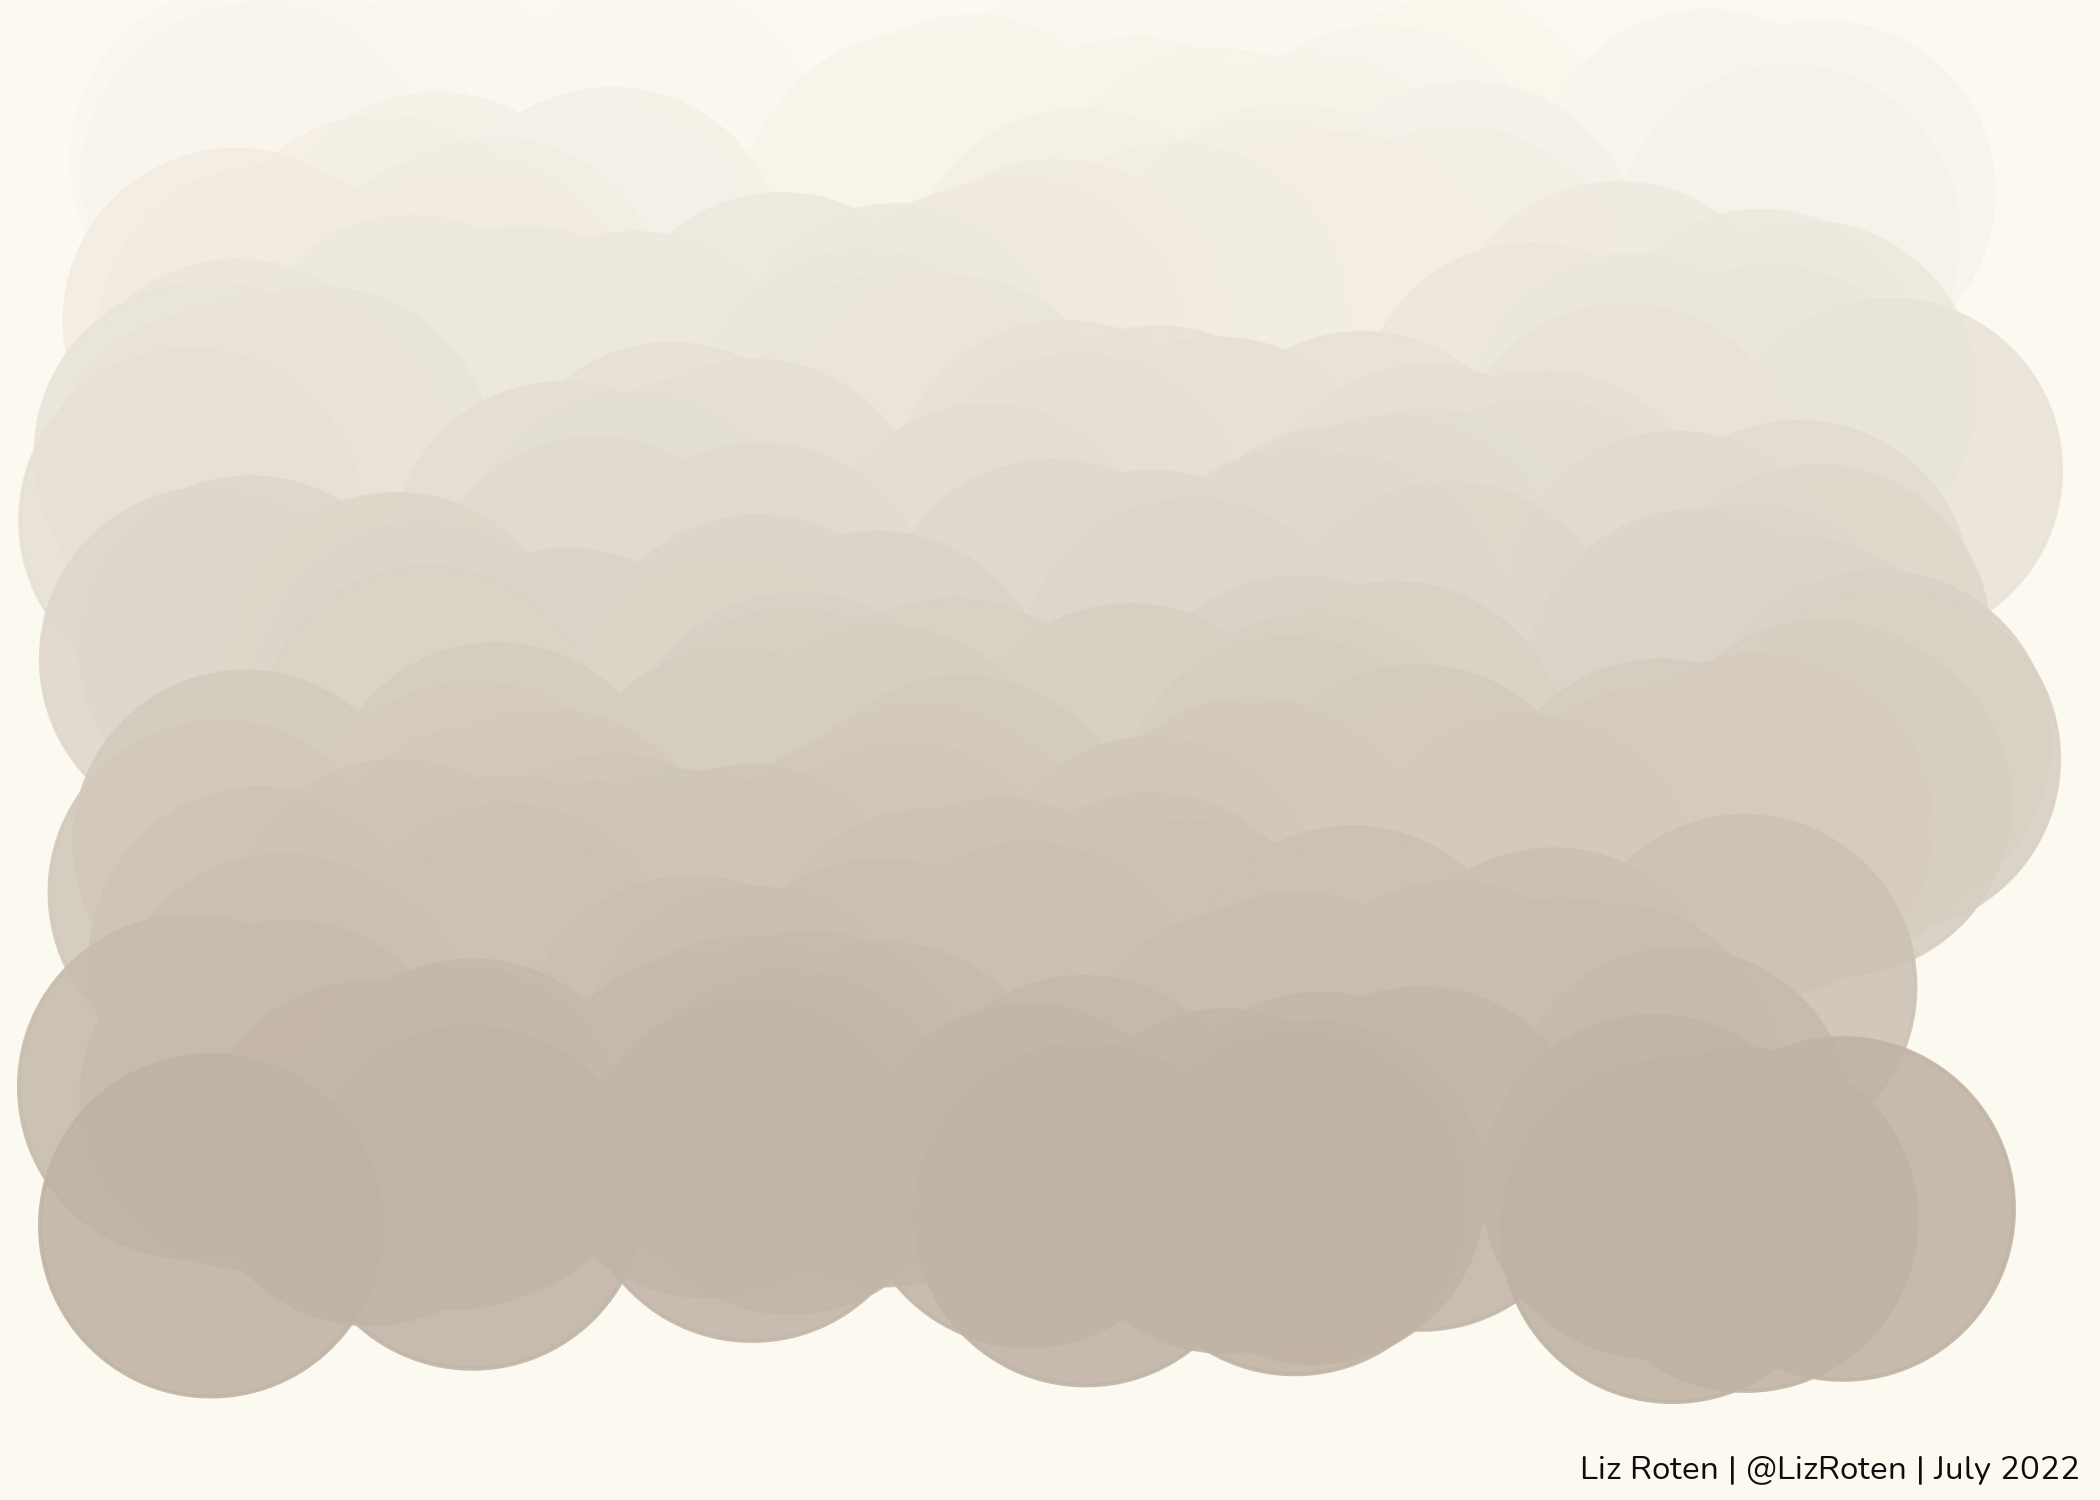
Gradient bubbles
Notice {purrr} use to generate a plot for each color all at once.
set.seed(24601)

split_palette <- create_palette_ramp(200) %>%
  filter(family != "white") %>%
  arrange(family, -level) %>%
  group_by(family) %>%
  group_split()


purrr::map(split_palette, function(x) {
  p <- ggplot(
    x,
    aes(
      x = family,
      y = level,
      color = code
    )
  ) +
    geom_jitter(
      size = 38,
      width = .55,
      height = 0,
      alpha = 0.90
    ) +
    scale_color_identity() +
    # scale_y_discrete(limits = rev) +
    coord_cartesian(
      clip = "off",
      xlim = c(0.952, 1.058),
      ylim = c(-11.5, 208)
    ) +
    labs(caption = my_caption) +
    theme_minimal() +
    theme(
      axis.title = element_blank(),
      axis.text.x = element_blank(),
      panel.grid = element_blank(),
      axis.text.y = element_blank(),
      plot.caption = element_text(
        family = "Nunito",
        size = 25,
        color = noil_black(1),
        vjust = -1,
        margin = margin(10, 0, 0, 0, "pt")
      ),
      plot.caption.position = "plot",
      plot.margin = margin(5, 5, 10, 5, "pt"),
      plot.background = element_rect(
        fill = dutch_white,
        colour = NA
      )
    )
})
## [[1]]
##
## [[2]]
##
## [[3]]
##
## [[4]]
##
## [[5]]
##
## [[6]]
##
## [[7]]
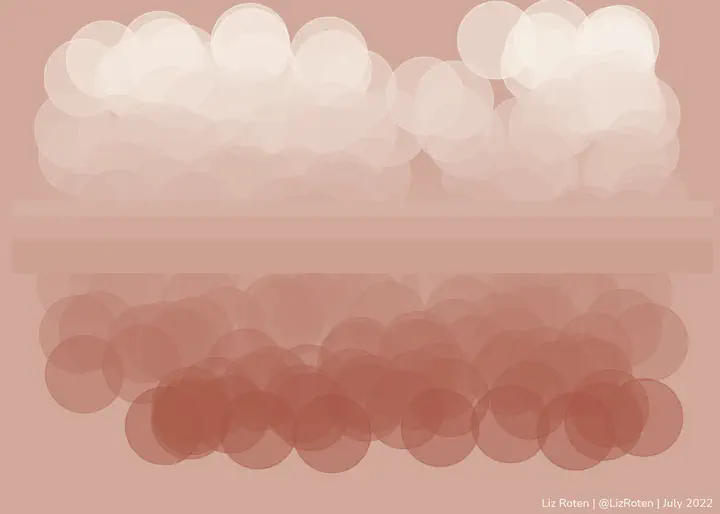
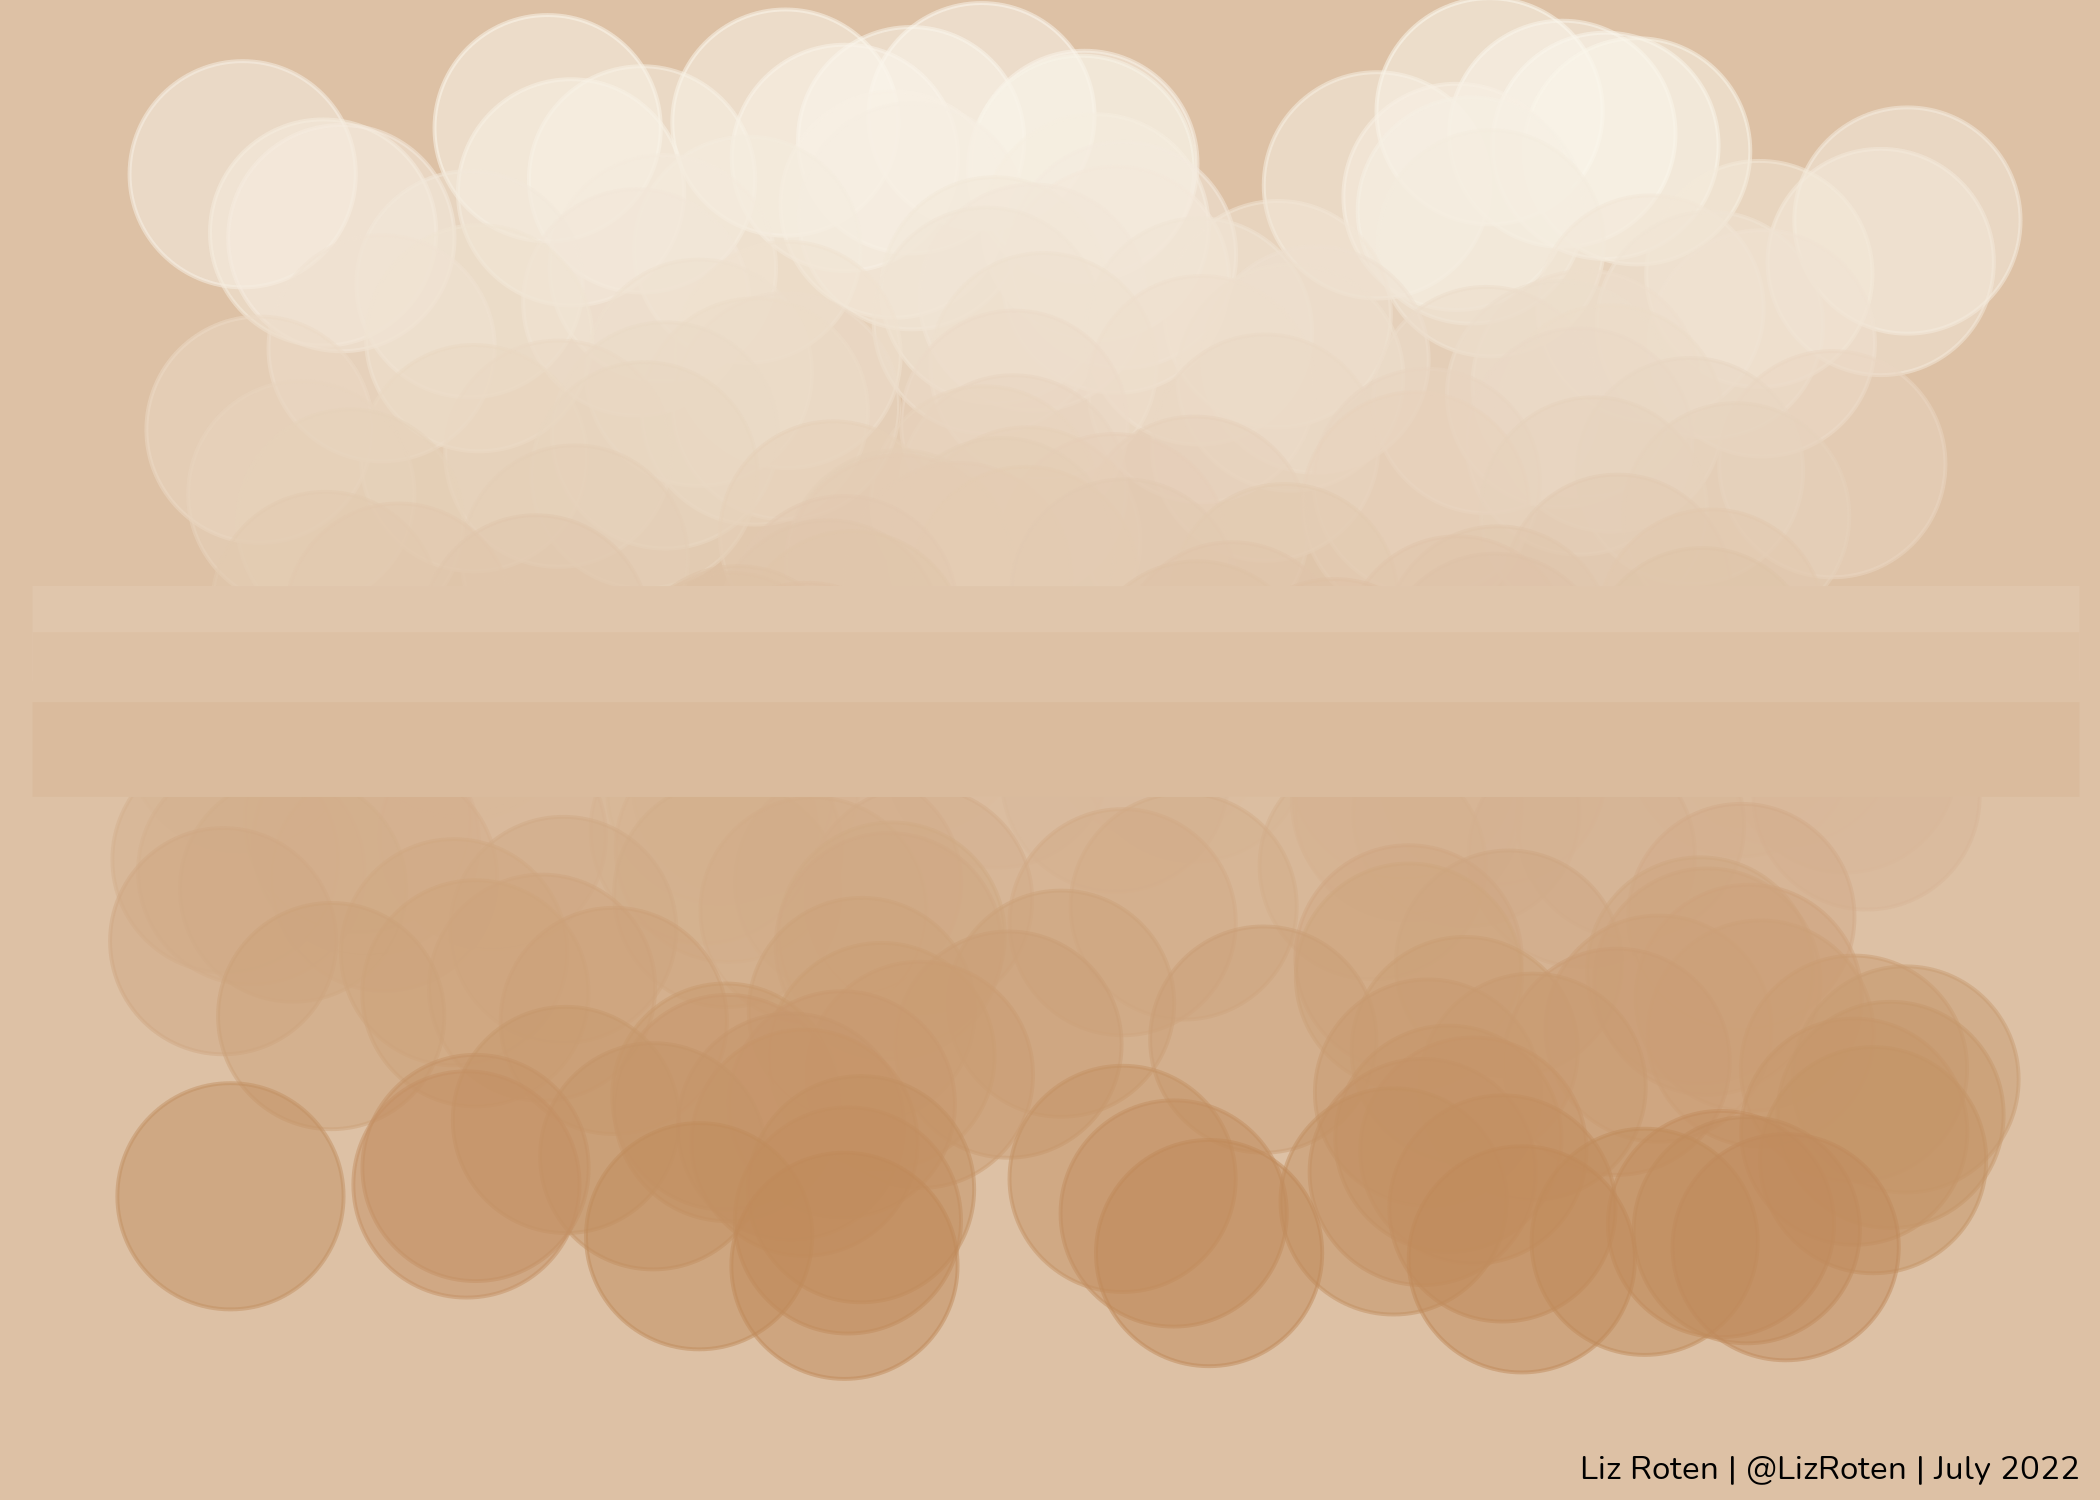
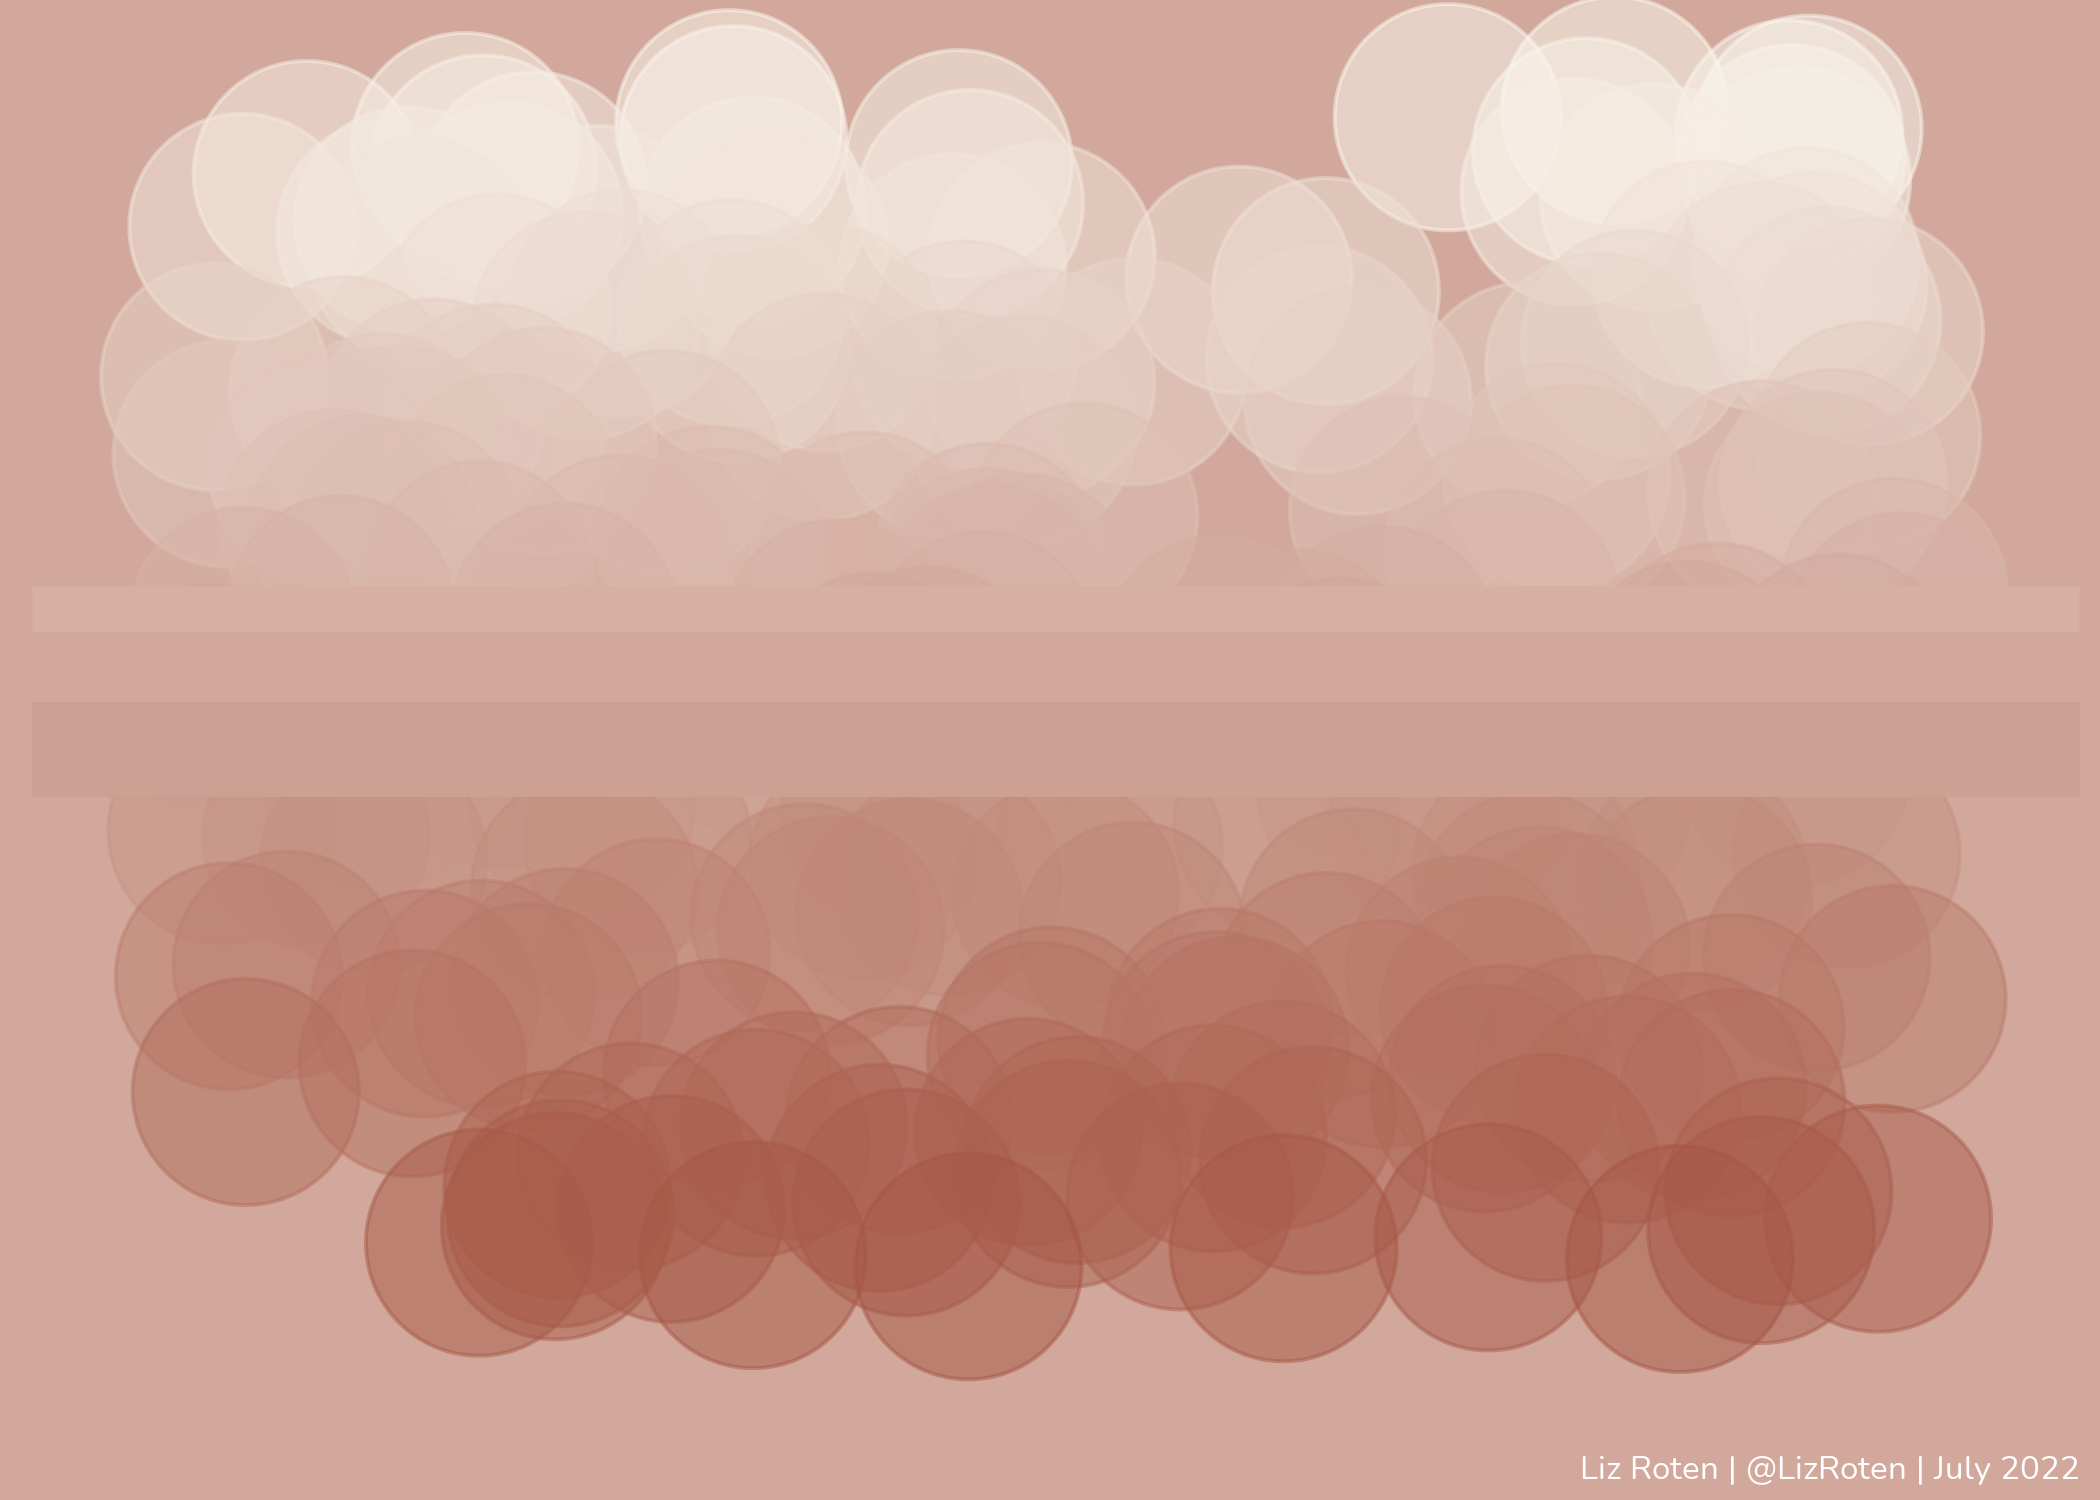
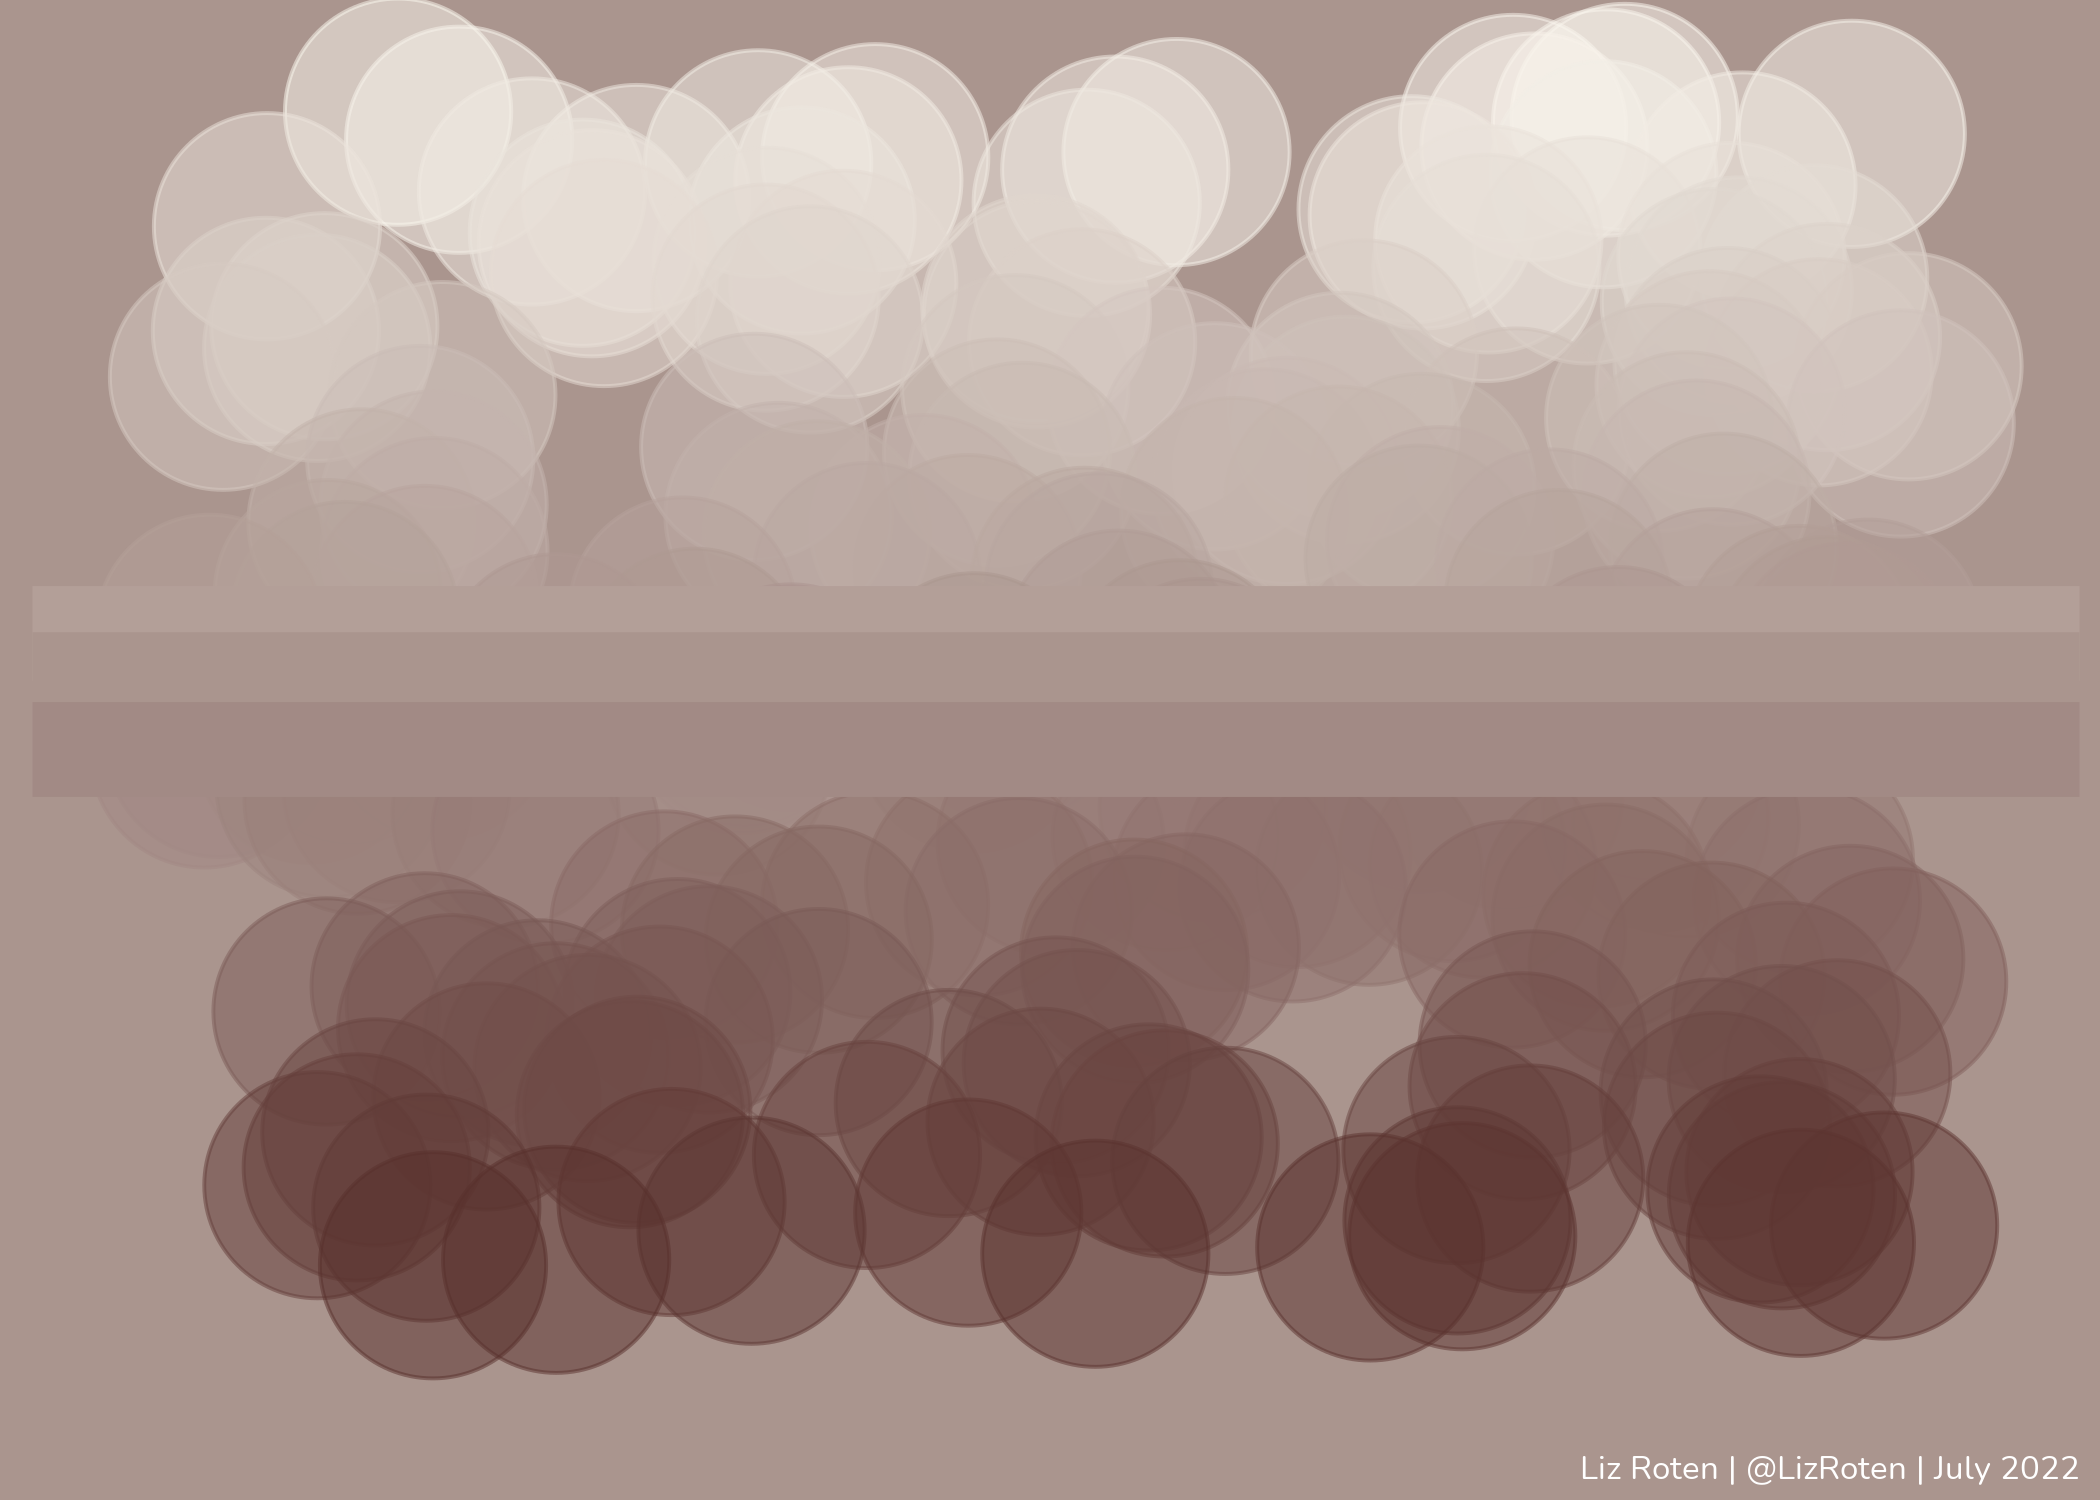
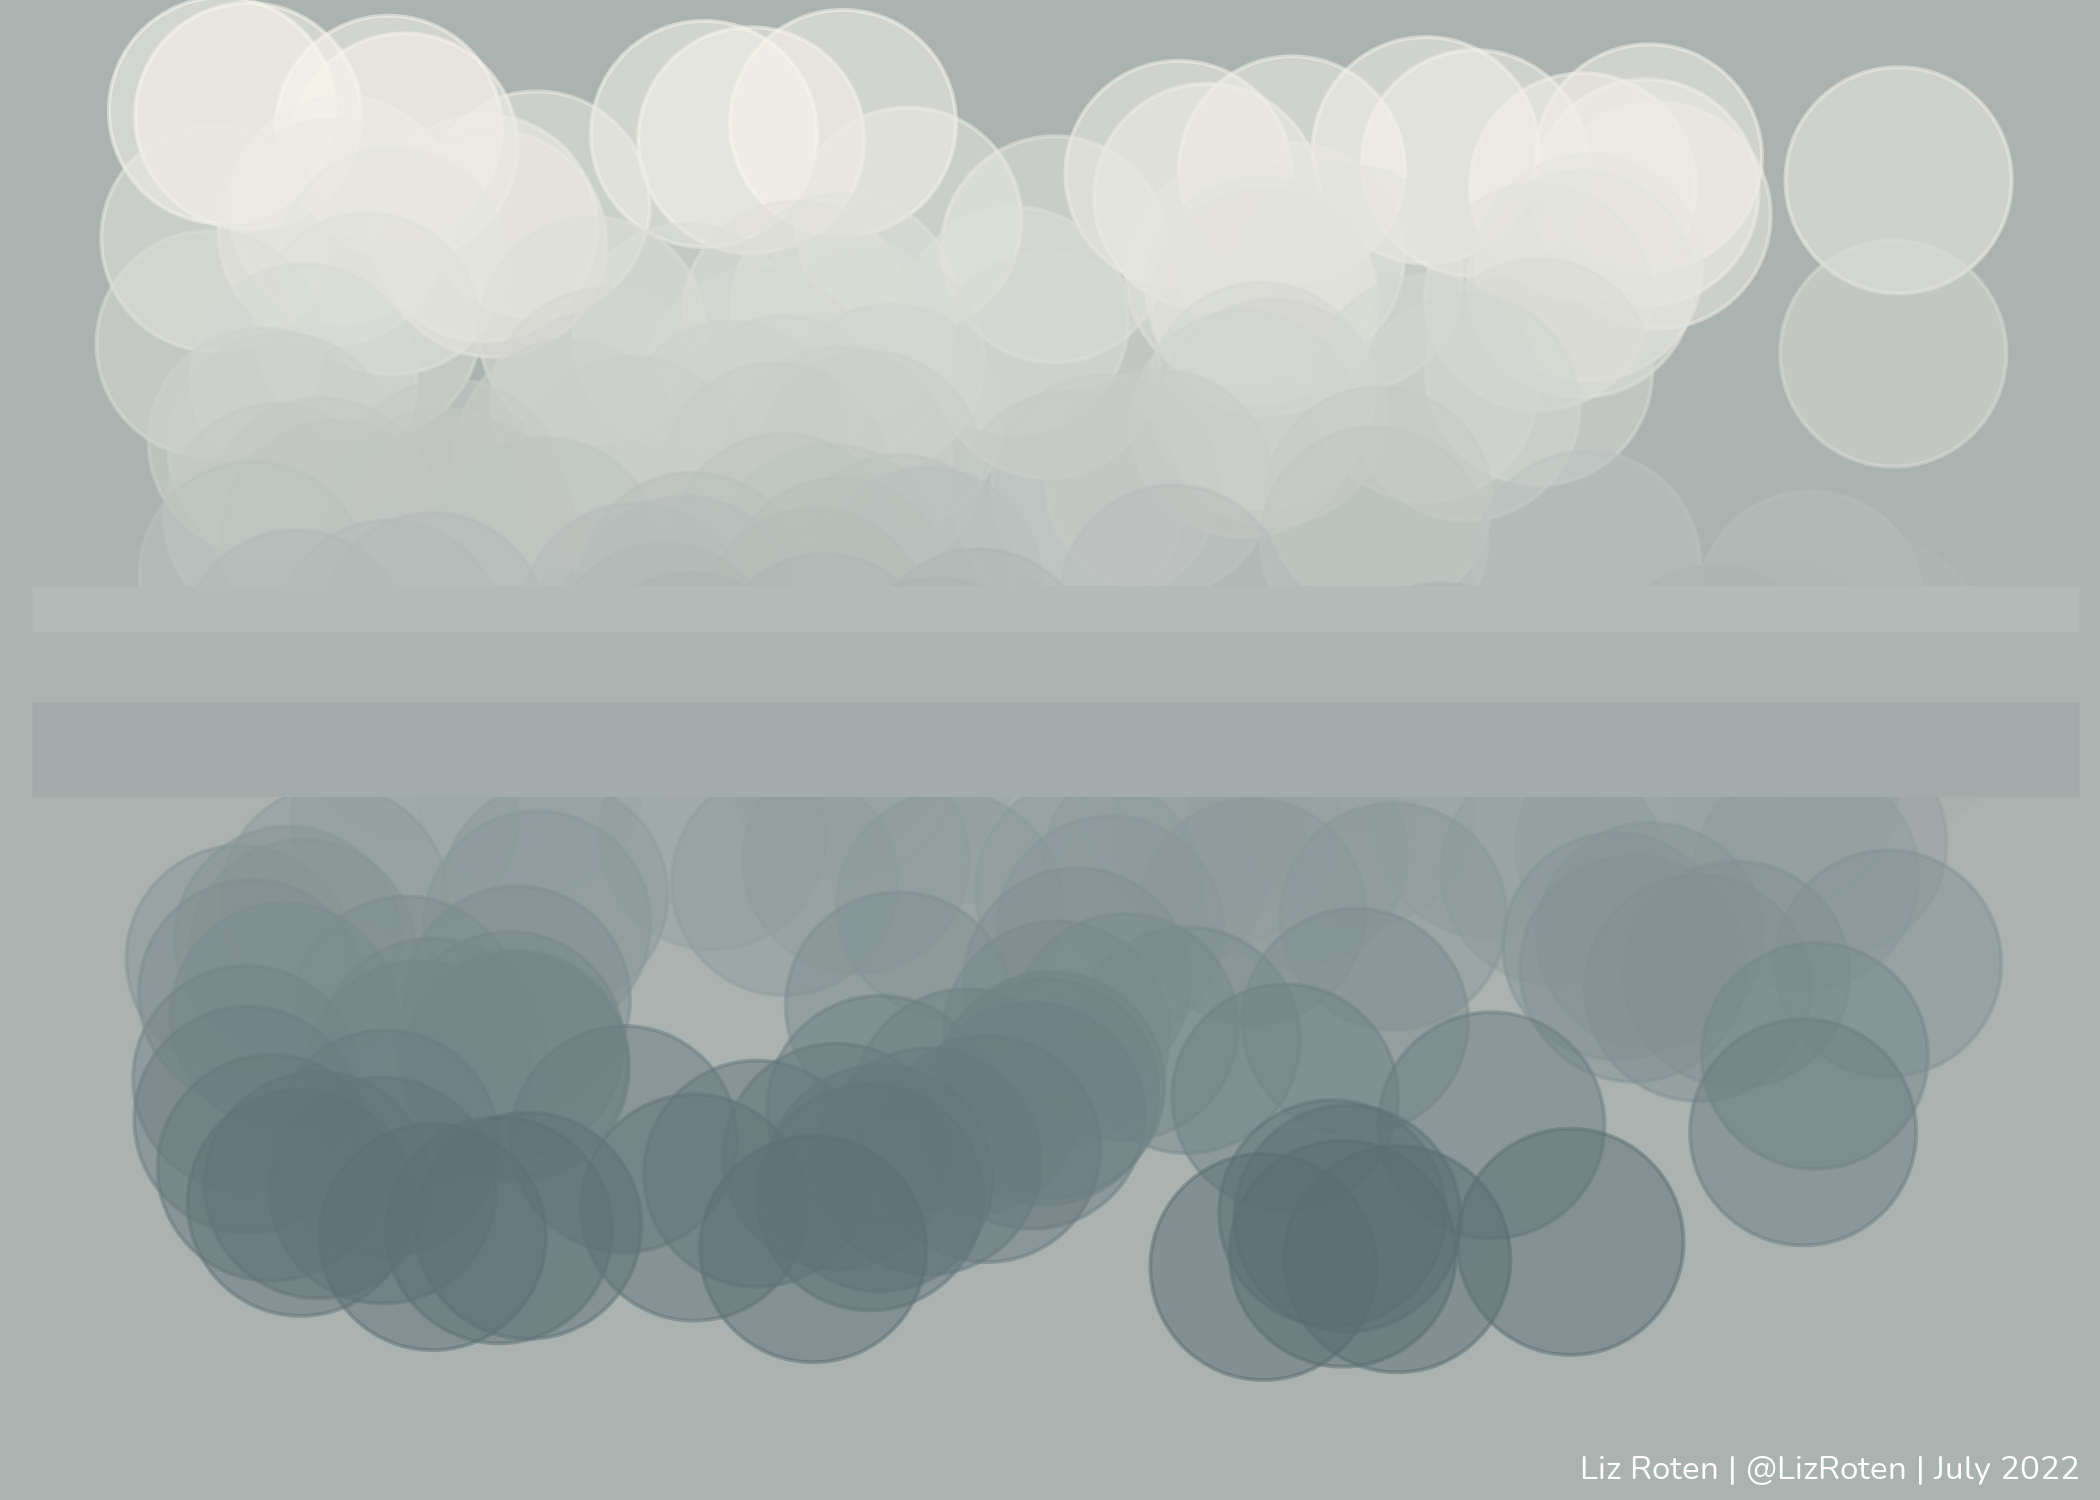
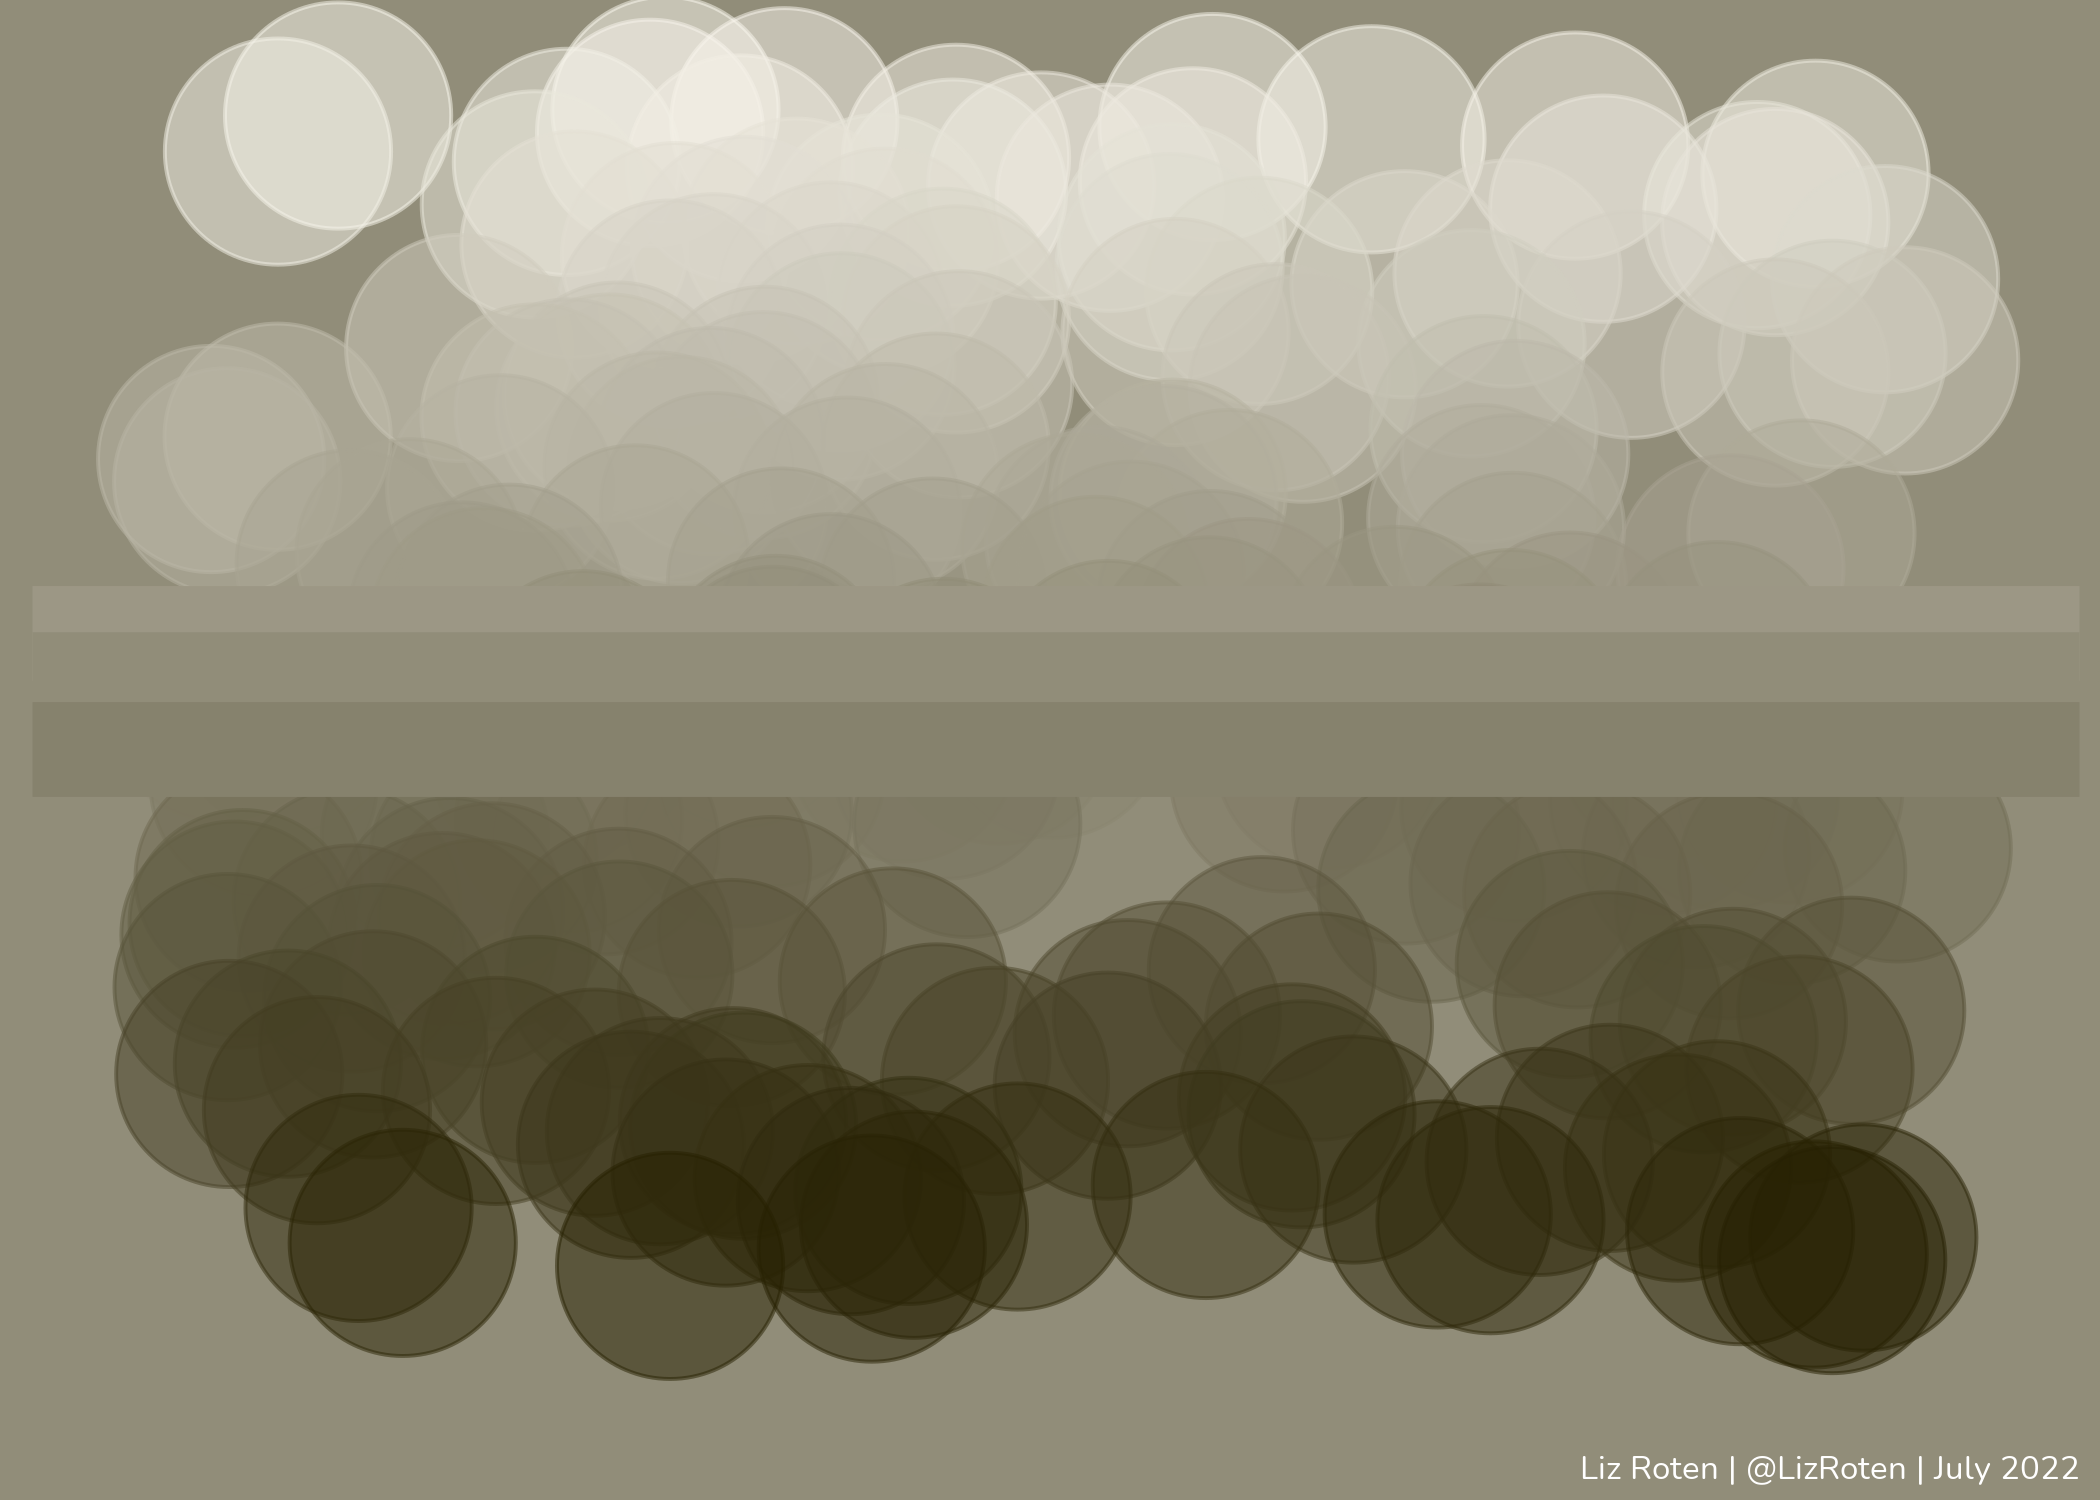
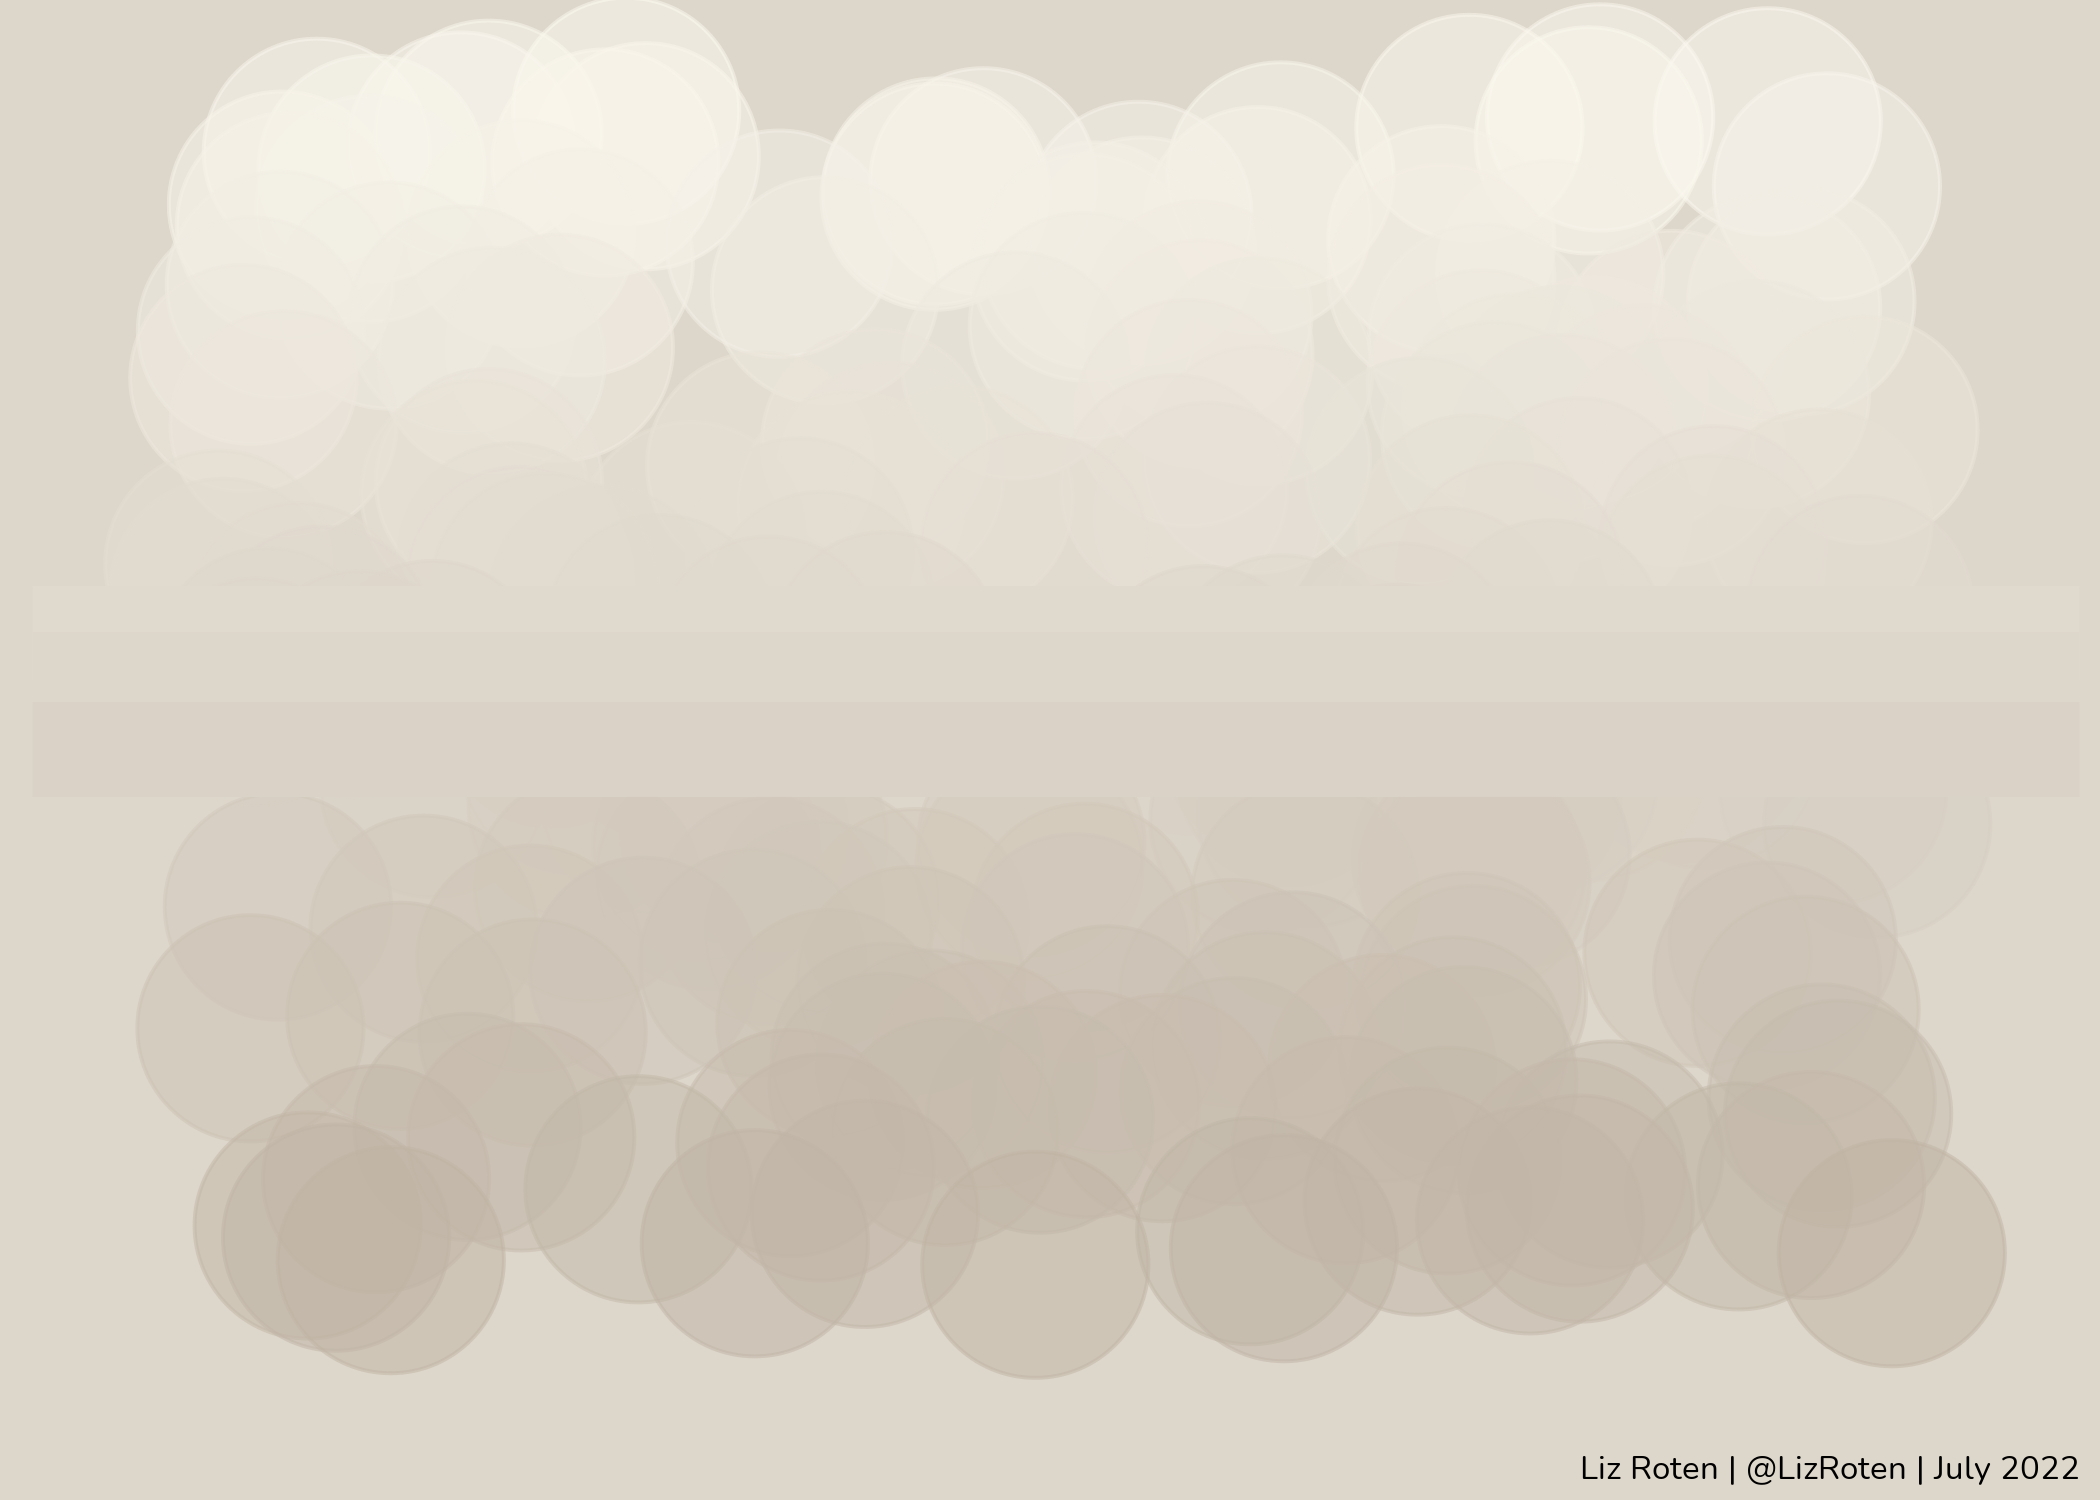
Gradient bubbles with bars
set.seed(24602)

split_palette_bubble <- create_palette_ramp(200) %>%
  filter(family != "white") %>%
  arrange(family, -level) %>%
  group_by(family) %>%
  group_split()


purrr::map(split_palette_bubble, function(x) {
  max_level <- max(x$level)
  ggplot(
    x,
    aes(
      x = family,
      y = level,
      color = code
    )
  ) +
    geom_jitter(
      size = 25,
      width = 0.5,
      height = 0.2,
      alpha = 0.5
    ) +
    scale_color_identity() +
    geom_hline(
      yintercept = max_level * 0.55,
      color = x$code[max_level * 0.45],
      size = 8
    ) +
    geom_hline(
      yintercept = max_level * 0.5,
      color = x$code[max_level * 0.5],
      size = 10
    ) +
    geom_hline(
      yintercept = max_level * 0.45,
      color = x$code[max_level * 0.55],
      size = 8
    ) +
    coord_cartesian(
      clip = "off",
      # xlim = c(-0.2, 0.2),
      ylim = c(-5, 205)
    ) +
    labs(caption = my_caption) +
    theme_minimal() +
    theme(
      axis.title = element_blank(),
      axis.text.x = element_blank(),
      panel.grid = element_blank(),
      axis.text.y = element_blank(),
      plot.background = element_rect(
        fill = x$code[max_level * 0.5],
        colour = NA
      ),
      plot.caption = element_text(
        family = "Nunito", size = 25,
        color = ifelse(unique(x$family) %in% c(
          "acorn",
          "taupe"
        ), "black", "white"),
        vjust = -1,
        margin = margin(10, 0, 0, 0, "pt")
      ),
      plot.caption.position = "plot",
      plot.margin = margin(5, 5, 10, 5, "pt")
    )
})
## [[1]]
##
## [[2]]
##
## [[3]]
##
## [[4]]
##
## [[5]]

##
## [[6]]
##
## [[7]]
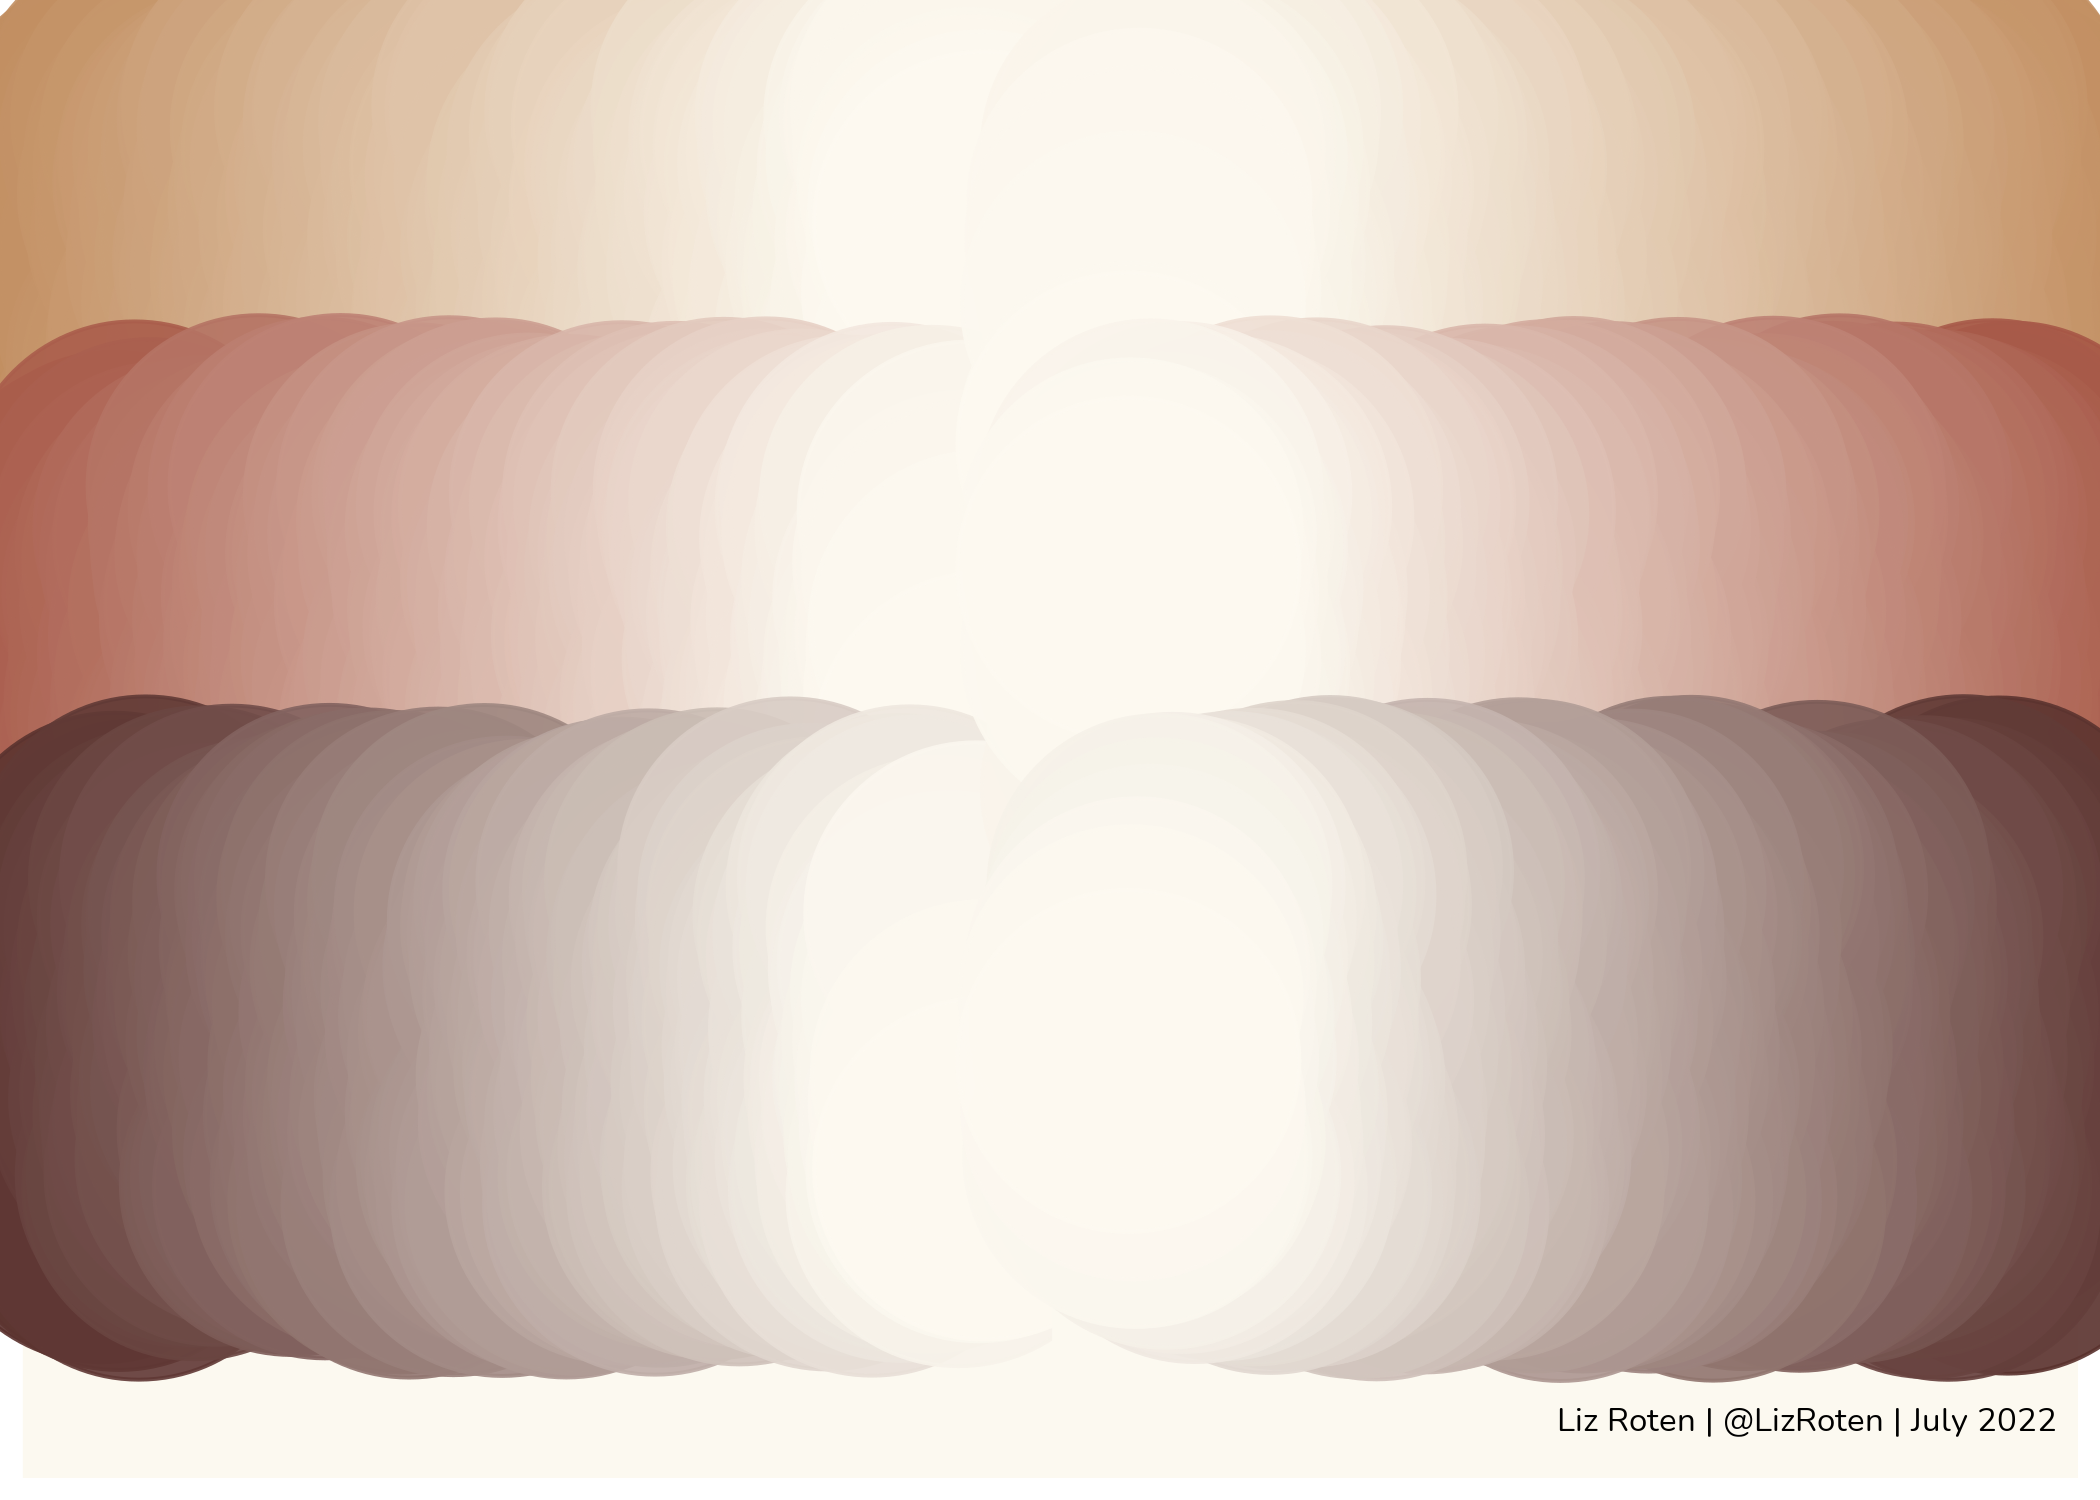
Diverging bubbles
set.seed(24601)

select_pal <- create_palette_ramp(400) %>%
  filter(family %in% c(
    "brick",
    "clay",
    "acorn"
    # "taupe"
  )) %>%
  arrange(family, level)

p <- ggplot(
  select_pal,
  aes(
    y = family,
    x = level,
    color = code
  )
) +
  geom_jitter(
    size = 38,
    height = .45,
    width = 0,
    alpha = 0.90
  ) +
  scale_color_identity() +
  scale_y_discrete(limits = rev) +
  coord_cartesian(clip = "off") +
  theme_minimal() +
  theme(
    axis.title = element_blank(),
    axis.text.x = element_blank(),
    panel.grid = element_blank(),
    axis.text.y = element_blank(),
    plot.background = element_rect(
      fill = dutch_white,
      colour = NA
    )
  )

p + (p + scale_x_reverse()) +
  labs(caption = my_caption) +
  theme(
    plot.caption = element_text(
      family = "Nunito",
      size = 25,
      color = "black",
      vjust = -1,
      margin = margin(15, 0, 0, 0, "pt")
    ),
    plot.caption.position = "plot",
    plot.margin = margin(5, 5, 10, 5, "pt")
  )
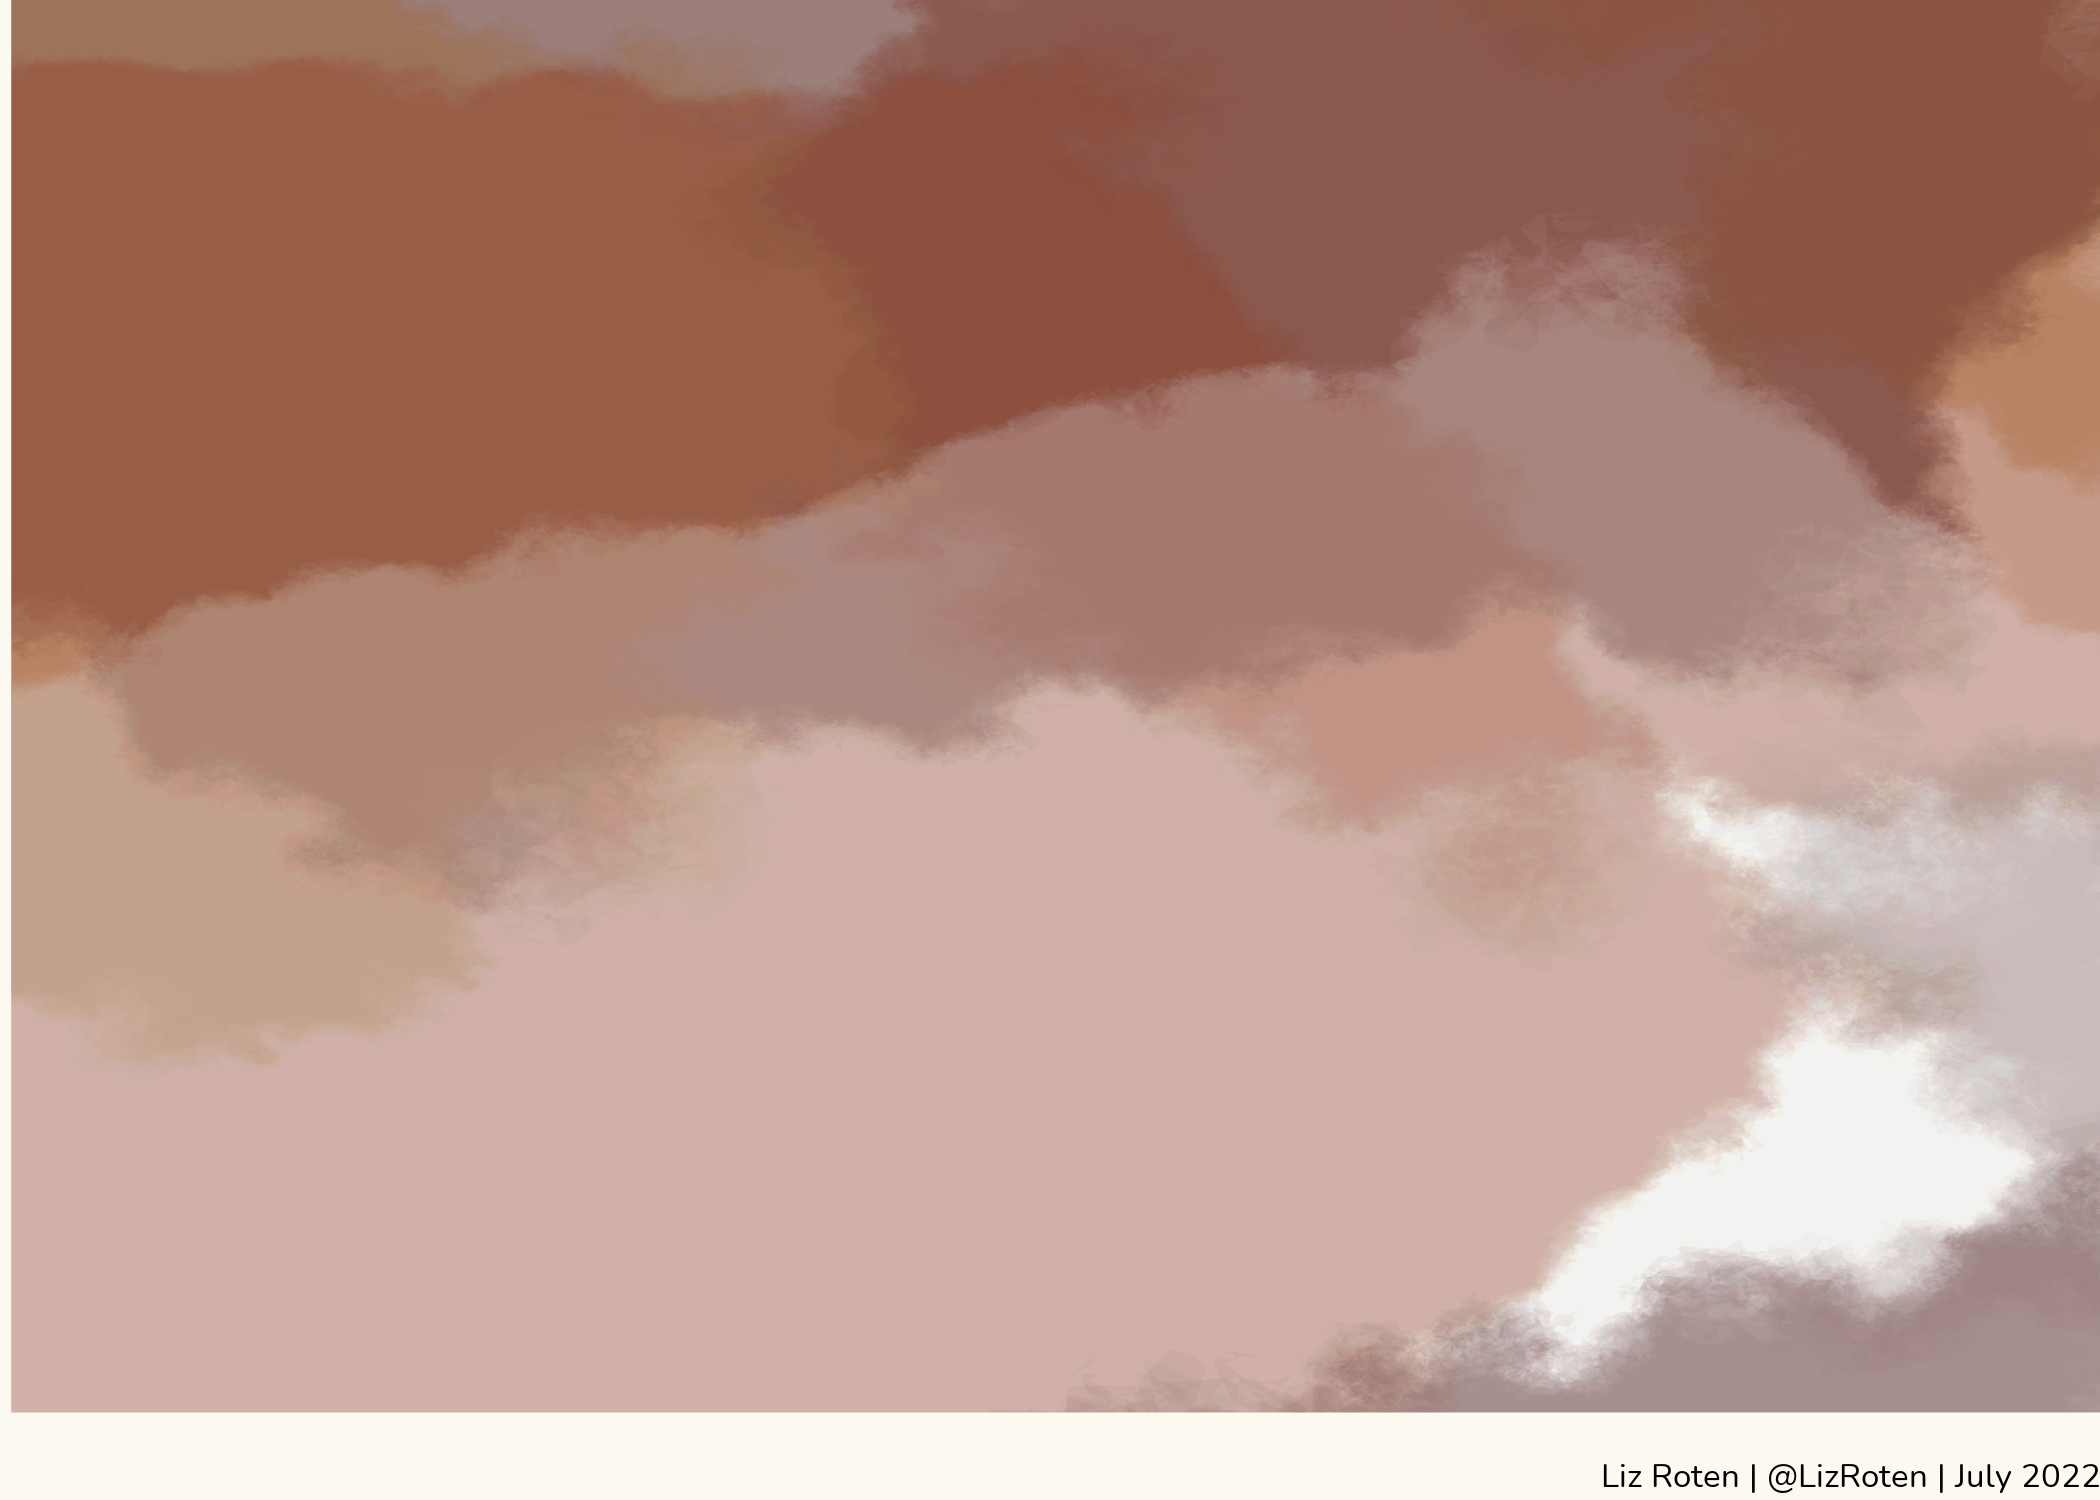
Watercolor-style abstracts
load(file = "data/seed_state.RData")
wat <- canvas_watercolors(
  colors = c(
    acorn(1),
    brick(1),
    clay(1),
    acorn(1),
    brick(2),
    clay(3)
  ),
  background = dutch_white,
  layers = 20,
  resolution = 300,
  depth = 5
)
wat +
  coord_cartesian(
    ylim = c(100, 200),
    xlim = c(75, 175)
  ) +
  labs(caption = my_caption) +
  theme(
    plot.caption = element_text(
      family = "Nunito", size = 25,
      color = "black",
      vjust = -1,
      margin = margin(0, 2, 0, 0, "pt")
    ),
    plot.caption.position = "plot",
    plot.margin = margin(0, 0, 8, 0, "pt")
  )